

Coming soon:
Peak oil, peak driving, peak cars
Part III: U.S. driving hits the wall
By Roger Baker / The Rag Blog / July 7, 2011
[This is the third part of a series by Roger Baker on transportation, centering on the issue of peak oil and its ramifications.]
Peak driving has many causes
In my last post, we saw that total U.S. driving hit a peak back in 2007. This time we will take a closer look at the situation to examine the reasons, the implications, and the prospects for the future of driving in the United States.
There are a number of contributing factors behind the 2007 peak. High unemployment simultaneously reduces the need to commute as well as the ability to afford to do so. There is the deteriorating condition of U.S. roads amidst increasing congestion. U.S. government grants to the states for highways are anticipated to drop further from the current level of $41 billion a year to about $32b next year.
The reduction in driving is not only due to high fuel prices as various observers have noted. It seems to be part of a global trend that predates the big runup in fuel prices.
A fairly recent study by economists Kenneth Small and Kurt van Dender found that a 10 percent increase in gas prices leads to a 0.2. to 0.3 percent reduction in driving in the short run, and an eventual reduction of 1.1 to 1.5 percent. But does this explain the driving slowdown? Maybe partially, but not entirely.
The growth of driving began to abate around 2000, and driving flattened out around 2004; the big gas price hikes didn’t come until late in the decade. Besides, though the graph I showed you last time has a couple of kinks in the 1970s, the relentless rise in driving basically shrugged off a comparable (in real terms) runup in oil prices during that decade.
Another factor is that an aging U.S. population tends to drive less. A recent AARP report, “How the Travel Patterns of Older Adults Are Changing,” predicts that older travelers will change the landscape of transportation in coming years, and concludes that transportation planners and policy makers must adapt to this shift. The number of Americans 65 and older is projected to rise by 60 percent in the next 15 years.
Seniors are piling onto public transportation
This analysis of the 2009 National Household Travel Survey by Jana Lynott and Carlos Figueiredo found that:
- Older adults comprise an increasing share of the nation’s travel.
- Although individuals are traveling less, particularly in private vehicles, public transportation use is up.
- Older men are more mobile than older women; however, the gap has been narrowing.
- The number of older non-drivers has grown by more than 1.1 million.
Driving less is mostly due to the economy
The closer we look, the more evidence we find that the single biggest factor behind both the driving and car ownership decrease is the economy. The cost of driving has been going up a lot faster than average income. A new poll that helps to reveal the degree to which high fuel prices are impacting average folks concludes that about 40% are already stressed by steadily rising driving costs.
If we look at driving trends among young people we see that driving as a favorite teenage pastime is in decline. It is hard not to attribute a lot of this decline to the fact that the unemployment rate among youth is at a depression level of about 24%.
Thanks to a Brookings Institution report on U.S. metropolitan areas released last year, we can easily see the strong link between household income and car ownership.
If we go to the Brookings site we find all kinds of interesting demographic data on an interactive U.S. map, and sometimes yearly data series, for most major U.S. metropolitan areas. In this case, we can choose a city, go to “explore the data,” then “commuting,” and then “Vehicles availability by median household income.” The income cutoff points used are: 80% of average is Low; 81-150% is Medium; and 150% of median or above is the High income category.
The report shows that most of the bottom third or so of households in U.S. metropolitan areas are unable to afford family cars. These households typically only have a 30-40% vehicle ownership rate. Of the roughly third in household income above that, comprising what we might often call the middle class, roughly 80% own cars. In the top third, typically about 90% of households own cars.
Following are NO-CAR family percentages for Texas and other big U.S. cities in 2008.
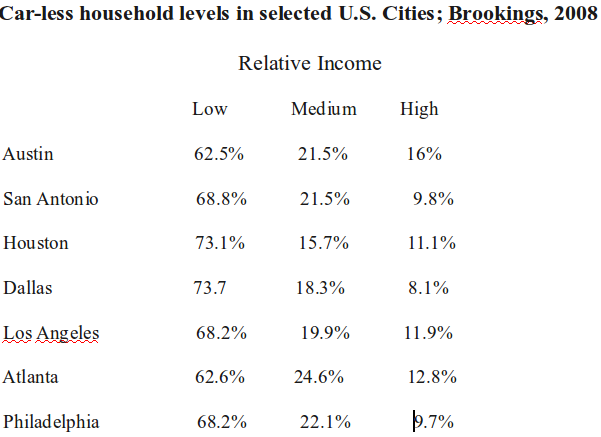
In each case, we see dramatic differences in household car ownership by income level, usually differing by a factor of four or more between the high and the low income levels. It is apparent that perhaps a quarter of U.S. households can’t afford to own cars now. It is apparent that any continuation of the current hard times combined with higher driving costs will decrease car ownership and driving even more.
Since the data above is for 2008 car ownership, such ownership at the bottom end must have declined further, since the cost of driving has now risen above the previous 2008 peak. It appears likely that high imported oil prices are now killing the current recovery.
PRINCETON, NJ — The slight majority of Americans, 53%, say they have responded to today’s steep gas prices by making major changes in their personal lives, while 46% say they have not. Sizable proportions of adults of all major income levels have made such changes, including 68% of low-income Americans, 54% of middle-income Americans, and 44% of upper-income Americans.
What about the family budget available for driving? We can use the interactive map at the same Brookings link to see a series of yearly metropolitan income trends ending in 2009. Here we see that most metro areas show a striking decrease in median family income over the past decade, commonly 10% or more.
Economists often say that the core rate of U.S. inflation is just a few percent, since this core rate calculates inflation to exclude food and energy and focuses more on labor costs. However, at the low end of the car driver income scale, necessities like food and fuel and housing make up a comparatively larger portion of the family income. For low income drivers, inflation is effectively higher.
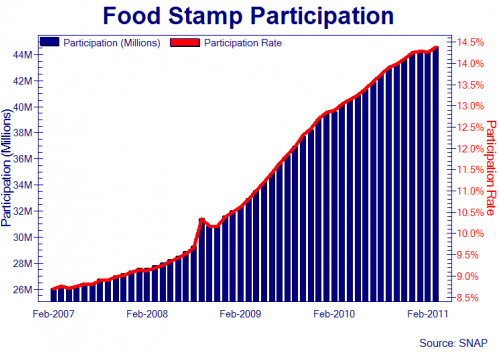
Another way to track the economic stress level for low income families is food stamps, where we see a large increase in use since 2008. Those who can afford to buy new cars are switching to smaller, more fuel efficient cars. Those who can’t are trying to keep their current cars running longer.
People aren’t buying expensive items like cars and durable goods as much as they used to. Not even gas-saving hybrid cars are exempt from this downward trend. Interestingly, spikes in searches for maintenance related issues like “new tires” and “oil change” suggest people are looking for ways to keep their old cars running longer… A record number of Americans — around 45 million — now rely on food stamps. That means nearly 1 in 7 people, or 14%, are living on food stamps. The number of food stamp recipients increased 16% in 2010.
There is a lot of other evidence of a strong shift underway from two car families to one car families. A number of reasons for the decline in car ownership in recent years are reviewed here.
Ten reasons for drop in car ownership
In the United States, we embarrassingly have more vehicles than people with driver’s licenses. We have 246 million vehicles. AAA estimates that it costs $8,000 per year for each car owned, which creates a financial burden on cash-strapped Americans… One Car Households. The average suburban U.S. household has two vehicles. Some more. The average urban U.S. household has one vehicle. More American families and roommates are going from three cars to two cars to one car…
The latest polls show that about 40% of the US population is being squeezed hard by the rising cost of driving which now consumes about 20% of the typical family budget, even while total household income remains flat and families struggle to cope with a backlog of credit card debt and increasingly burdensome mortgage payments. There can be little doubt that American family budgets are now being severely stressed by the rising costs of driving their cars.
NEW YORK (CNNMoney) — Wal-Mart’s core shoppers are running out of money much faster than a year ago due to rising gasoline prices, and the retail giant is worried, CEO Mike Duke said Wednesday. “We’re seeing core consumers under a lot of pressure,” Duke said at an event in New York. “There’s no doubt that rising fuel prices are having an impact.”
Wal-Mart shoppers, many of whom live paycheck to paycheck, typically shop in bulk at the beginning of the month when their paychecks come in. Lately, they’re “running out of money” at a faster clip, he said. “Purchases are really dropping off by the end of the month even more than last year,” Duke said. “This end-of-month [purchases] cycle is growing to be a concern.”
In Texas, we can see that the big box retailers are quite concerned that their customers are running out of money because of the cost of driving, causing them to shop less, especially toward the end of the month.
High gas costs are changing consumers’ shopping habits, and that’s hurting national retail chains like Wal-Mart Stores Inc. In fact, one in five Walmart moms list gasoline costs as their top expense behind housing and car payments, Wal-Mart spokesman Greg Rossiter said. Wal-Mart recently reported its eighth consecutive quarter of sales declines at U.S. stores open at least one year.“You know, it’s just a ripple effect,” Rossiter said. “These concerns aren’t geographic — they aren’t limited to any part of the country.”

Further evidence for a big shift in U.S. driving behavior;
Elasticity of demand with driving cost
It used to be thought that the amount of driving in the U.S. was relatively blind to fuel cost. As economists would say, driving demand is an inelastic function of the cost of driving. In the past, most Americans would tend to spend less elsewhere in order to keep driving about as much. The need for U.S. drivers to keep driving at all costs in order to get to work and do other vital errands meant that they willing to pay a high price at the pump to keep driving.
In economic terms this is called a low elasticity of demand with fuel price. Over the longer run, people can move closer to work, or buy a smaller car, but over the short run they are stuck with paying, no matter what their fuel costs. However, this assumption has its limits when we reach the point that growing numbers simply can’t afford to drive. The decrease in car driving and ownership due to a higher driving cost is resulting in a growing increase in the elasticity of oil demand with higher fuel price.
This snip from an insightful analysis by Tom Whipple reviews the conventional wisdom on the elasticity of driving with fuel prices. The conclusion is that these elasticity numbers may have reflected driving behavior in response to fuel price increases in the past, but not necessarily currently when many drivers are being forced to give up driving in order to support other equally important survival costs like food and housing.
In the very short run, motorists have no choice but to spend whatever it costs to keep their automobiles and trucks running for their livelihoods depend on it. Over the course of a year or so, some can move to substitute forms of transport, cut back on discretionary travel, and, if they have a choice, use more fuel efficient vehicles.
Within a year, all this should add up to an elasticity of demand of roughly -0.26 suggesting that for every 10 percent increase in gasoline prices, gasoline demand should fall by 2.6 percent. If prices remain high for several years, then the elasticity number goes to -.58 suggesting that the demand will fall by 5.8 percent for every 10 percent increase in prices. These numbers of course were derived from past experience in a simpler time before global oil production had peaked and price run-ups were mostly short-lived.
This diversion of spending toward fuel for cars automatically subtracts consumer spending, the bulk of the U.S. economy, from other areas. If the food and fuel and commodity sector of the economy is seeing inflation, this subtracts spending from other discretionary spending areas of the economy.
Inflation in the relatively necessary energy sector subtracts spending and generates deflation in the other sectors, hurting consumer wages of those drivers in the service sector of the economy. With U.S. income stagnant, a combination of inflation for non-discretionary expenses like driving and a simultaneous cutback in discretionary consumer spending in other areas adds up to stagflation. This is bad news to economists, since there is no good economic remedy.
The British Economist has noticed a fundamental shift in U.S. driving behavior.
Yet, here’s the conundrum. Following all previous recessions, petrol consumption has been a leading indicator of recovery, bouncing back sharply as people started using their vehicles more to shop, to dine out, to seek the curious and the entertaining, and, above all, to take vacations. Despite the American economy’s belated and still timid recovery — seen in increasing sales of cars, clothing, hospitality, entertainment, and consumer goods generally (though still not housing) — the amount of petrol being consumed across the country has tumbled to 2001 levels, and shows every sign of falling further.
The Bureau of Economic Analysis, the federal agency that churns out monthly reports on how the economy is faring, believes the 2008 spike in petrol prices and the subsequent recession have changed the consumption patterns of American motorists irreversibly. How so? The short answer is that technology and marketing have altered the type of vehicles Americans are now buying
Driving behavior and public opinion toward driving are both changing in the world’s more affluent countries.
Until now, most projections for future energy use and transportation needs have taken for granted that there will always be more people owning more cars, driving farther and using more oil. But those assumptions are being put to the test by a profound change under way in the countries that have long been the world’s biggest fuel consumers. And it goes beyond the payoff that is already being realized from government fuel economy efforts, like the U.S. government’s announcement today of enhanced consumer labeling to promote efficient vehicles.
We could already see a big change in 2008 when rising fuel price spiked driving costs. “From 1970 to 2008, total highway fuel consumption increased from 92 billion gallons to nearly 181 billion gallons in 2007. The vehicle fuel consumption decreased to 175 billion gallons in 2008.” The fact that we are driving less and using less fuel for years suggests that all the easy changes have already been made.
Driving costs are even higher now, while incomes are relatively lower, leading to a trend toward single car families.
Many families limiting themselves to a single car
Motivated by the declining economy, rising gas prices and a concern for the environment, families like the Rogerses say they are starting to rethink the need to have more than one car. Make no mistake, however: America’s love affair with the automobile is still strong. According to a February study by Experian Automotive, which specializes in collecting and analyzing automotive data, Americans own an average of 2.28 vehicles per household, and more than 35 percent of households own three or more cars.
But there are signs of change. Brian Gluckman, a spokesman for AutoTrader.com, a leading automotive Web site, said more buyers were moving to one car. Until the last three months, Mr. Gluckman said, that car tended to be a midsize S.U.V. or crossovers. He said AutoTrader.com’s more recent data showed buyers shifting toward smaller, more fuel-efficient vehicles.
U.S. transit demand grows
 As both driving and cars on the road peak while the need for transportation remains relatively constant, it is apparent that the public will tend to seek out alternatives to cars. The rapid increase in bikes being used for commuting is one sign of this trend. See Fig. 3: “Trend in Share of Workers Commuting by Bike in Large North American Cities, 1990-2009” Another indication is car sharing, which is also growing rapidly.
A loss of driving affordability tends to turn up as increased transit use whenever the transit is useful and available.
Transit ridership up due to rising gas prices
by Joseph Cutrufo on Thursday, May 5, 2011It was only a matter of time: Transit agencies are reporting increased ridership due to higher gas prices. With the national average for a gallon of regular unleaded now at $3.98, motorists across the nation are switching to public transportation. We saw it in 2008, when the national average reached $4, and we’re seeing it all over again. According to the American Public Transportation Association, $4 per gallon is the tipping point where people begin to drive less and use transit more — a lot more. If gas prices stay this high, we can expect an additional 670 billion transit trips made this year nationwide.
When fuel prices get high enough, many are willing to shift to transit since they must get to work somehow.
PRINCETON, NJ — Americans are most likely to say they would seek vehicles that get better gas mileage if gas prices keep rising but don’t go above the $5-per-gallon range. Americans are second most likely to say they would use mass transit. Seven in 10 Americans would not move and about the same number of workers would not change jobs or quit working, no matter how high prices rise.
Nothing could be more positive for increasing transit use than for the cost of car driving and car ownership to go high enough so that broad new sectors of the population seek to use it. The current stress of rising fuel prices on the family budget is indeed causing a national increase in transit ridership.
Higher gas prices driving motorists to mass transit
“When gas prices hit $3, we see serious interest,” Williams said. “Some people come and leave (when gas prices recede). Others come and stay. “The link between higher gas prices and increased use of mass transit is a significant one. It could get even more pronounced. According to a study by the American Public Transportation Association, the U.S. will see an additional 1.5 billion mass transit boardings per year if gas reaches $5 per gallon.
A lot of the new potential users are senior citizens. In particular, the aging baby boomer population is increasing its use of transit as this sector of the total population grows. However poor public transit is a threat, especially to older Americans.
A recent Brookings study has thoroughly documented the fact that, in the U.S., transit tends not to go where it is most needed to help low income workers get to work.
These trends have three broad implications for leaders at the local, regional, state, and national levels. Transportation leaders should make access to jobs an explicit priority in their spending and service decisions, especially given the budget pressures they face. Metro leaders should coordinate strategies regarding land use, economic development, and housing with transit decisions in order to ensure that transit reaches more people and more jobs efficiently. And federal officials should collect and disseminate standardized transit data to enable public, private, and non-profit actors to make more informed decisions and ultimately maximize the benefits of transit for labor markets.
Public support for transit will no doubt continue to increase along with decreasing driving, stagnating income, and higher driving cost, whenever the transit can be easily used. The problem is that much transit in the U.S., when it is available, does not go where it could be most useful. The private business sector is not much interested in helping out, so even jitneys are being suggested. Meanwhile, the expansion of transit service is becoming harder for local government to afford, just when it is most needed as an alternative to private cars.
![]() Transit, and especially rail, typically has high up-front capital costs despite the overall cost and energy savings of rail when it has a high ridership (“Electric traction offers a lower cost per mile of train operation but at a higher initial cost, which can only be justified on high traffic lines.”) One problem lies in trying to explain to the public that saving money on the initial cost is not always a smart long range policy. For now we should expect less federal help in spending for transit, and most other public infrastructure, as the result of the Congressional gridlock over the U.S. budget deficit.
Transit, and especially rail, typically has high up-front capital costs despite the overall cost and energy savings of rail when it has a high ridership (“Electric traction offers a lower cost per mile of train operation but at a higher initial cost, which can only be justified on high traffic lines.”) One problem lies in trying to explain to the public that saving money on the initial cost is not always a smart long range policy. For now we should expect less federal help in spending for transit, and most other public infrastructure, as the result of the Congressional gridlock over the U.S. budget deficit.
Widespread support for better public transportation awaits a broad turnaround in public opinion led by peak oil, higher fuel prices, and less affordable driving. As a nation, the U.S. is still in denial about the unsustainability of its car habit. The economic reality is stubborn, telling us that our transportation habits will soon have to change more than most American are willing to admit.
Why rising fuel prices are likely to prevent a driving recovery
Could we ever recover our previous driving or car ownership levels? The slow replacement rate of the vehicles now on the road strongly suggests that the current level of total U.S. driving cannot increase by very much, nor for very long.
Since the 2007 driving peak followed by the 2008 economic crisis, there has been a partial recovery in vehicle sales, but these sales have never approached the previous peak. U.S. family budgets for car replacement are shrinking as driving costs rise. People are hanging on to their old cars longer than ever, and a lot of SUV owners are financially unable to easily downsize to more fuel efficient cars. Currently, there is a shortage of small used cars and this is reflected in their relatively higher prices.
This is not to say that those who can afford to replace them are not already choosing smaller cars. Robert Sinclair Jr., a spokesman for the New York regional chapter of AAA, agrees that “we are witnessing a major sea change in both the types and number of vehicles on the road.”
There has been some backsliding on new vehicle mileage since 2008, but recently higher fuel prices will likely help turn this gas mileage trend around again.
Hybrid sales rose quickly in 2007 as gas prices climbed, then dropped noticeably in the second half of 2008 as gas prices plummeted from over $4 to $1.60. This time around, despite gas prices climbing steadily over the past year, hybrid cars shrunk from 2.9% of new vehicle sales in 2009 to 2.4% in 2010, according to Ward’s Auto. Meanwhile, sales of trucks, SUVs, crossovers and minivans rose from 48% of the market to 51% from 2009 to 2010. In addition, the average fuel economy rating of new vehicles sold in 2010 was 22.2 mpg, down from 22.3 mpg in 2009.
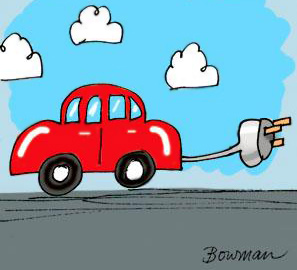
Some imagine that electric cars or smaller more fuel-efficient cars could make a big difference. They will make a difference, but probably only a small difference overall. For an economy structurally geared over decades to run on cheap oil to serve low density sprawl development, historic energy transitions like reducing dependence on oil for commuting turn out to be unexpectedly slow and expensive. Electric cars are not well suited for long suburban commutes, and are typically a lot more expensive when new than the current U.S. fleet of gas guzzlers.
Little prospect for a U.S. driving recovery as seen by the global economists
Oil prices have moved to center stage as a primary factor governing the recovery of the global economy.
Fatih Birol, chief economist of the International Energy Agency, said that the current price of $120 per barrel could be the catalyst for a global economic crisis on the scale of the one experienced in 2008. “If you don’t see any softening of the prices, there is a risk of derailing the economy, of a double-dip,” Dr Birol told the Reuters Global Energy and Climate Change Summit. “We all know what happened in 2008. Are we going to see the same movie?”
Oil prices fell nearly $3 in London to $117.30 and more than $5 in New York to $94.84 on worries about the faltering global economy. However, economists believe the price is still at a level near to tipping the global economy back into a downturn. To combat sky-high oil prices, the U.S. is reported to have attempted an ambitious swap with Saudi Arabia in the past month.
The IEA is now warning that a fuel supply bottleneck has emerged in the face of growing demand because the loss of Libyan sweet crude is hard to make up with increasingly low grade Saudi oil.
Last week saw the publication of the IEA’s monthly Oil Market Report (OMR) and its Medium Term Oil and Gas Markets outlook which projects the Agency’s assessment of global supply and demand for the next five years. In recent weeks the IEA has been sounding nearly non-stop warnings that ever since the Libyan and Yemen uprisings took some 1.5 million b/d off the oil markets there was a real danger of higher oil prices and shortages this summer.
The current publications are no exception. The Agency is still expecting global oil demand to increase this year by 1.3 million b/d to 89.3 million b/d with OECD demand down a bit due to high prices and the economic slowdown, and Chinese and Indian demand up a bit. The IEA says that global oil supply for May rose by 270,000 b/d from 87.41 billion b/d in April with 210,000 b/d coming from OPEC. The cartel is reported as supplying an average of 29.18 million b/d in May which is close to the Platts survey which put OPEC production for the month at 29.04 million b/d. The IEA, however, points out that the OPEC’s May production was still 1.25 million b/d below the pre-Libyan uprising level.
Here are the most recent two years of gasoline and diesel price trends which show a slight increase in 2009-2010 and then a big jump in the past year. The recent slight decline in gasoline price at the pump is tied to the poor economy and slack U.S. demand.
Fuel demand in North America will decline this year by 190,000 barrels to 23.7 million a day, the Paris-based IEA said. The agency lowered its forecast for the region by 220,000 barrels a day from last month’s report, citing lower growth projections from the International Monetary Fund… “High gasoline prices are scaring off some incremental demand,” said Rick Mueller, a principal with ESAI Energy, LLC in Wakefield, Massachusetts. “We’re going to see people conserve more and cut down on trips.”
If we look at the next few years, according to this analysis by Chris Martenson (and others equally savvy), we see that, even if nothing unexpected goes wrong, we can expect another serious oil price spike by about 2013, due to declining global supply and inflexible demand. Assuming fuel price trouble over the short term and trouble over the long term, how can U.S. driving recover?
The economists at Levy Institute don’t talk about oil much, but they do have excellent economic models that arrive at a gloomy outcome if U.S. trade cannot be brought back into better global balance. Their recent analysis, “Jobless Recovery Is No Recovery: Prospects for the U.S. Economy,” is pessimistic enough, even without mentioning peak oil. The best economic prescription the Levy economists offer is in part based on dollar devaluation. This, of course, would increase the cost of imported oil priced in dollars, reducing U.S. driving further.
It is not just driving that is in trouble because of fuel cost. This is arguably part of the bigger problem of global industrial production no longer being able to outrun global energy costs.
While it’s a positive that the U.S. is reducing its demand for oil, it doesn’t necessarily mean we are becoming more efficient. More to the point, the U.S. is no longer able to reduce its overall energy expenditures as an input to its GDP. Post 2008, some of the “gains” enjoyed by lower energy expenditures were simply made possible by a lower GDP.
When the U.S. reduces its use of oil, and switches over more to coal and natural gas, its GDP tends to fall. For an economy that structured itself towards oil-dependency the past 70 years, that should be expected. The U.S. therefore can have a higher GDP or a lower GDP, but the Energy Limit model reveals that energy costs are becoming more stubborn on the upside. This is a structural change, that will not revert.
Industrialism in the U.S., and elsewhere in the OECD, is therefore no longer able to outrun energy costs. This means that in order to maintain production, prices for assets like housing, and input costs we can produce less or measure “production” in non-industrial terms.
Either way, this megatrend is simply the reverse of the dynamic which began 250 years ago when humanity moved from wood to coal, and the impact on wages and asset prices was revolutionary. The same model which explains that ascent, now explains our descent.
 [Roger Baker is a long time transportation-oriented environmental activist, an amateur energy-oriented economist, an amateur scientist and science writer, and a founding member of and an advisor to the Association for the Study of Peak Oil-USA. He is active in the Green Party and the ACLU, and is a director of the Save Our Springs Association and the Save Barton Creek Association in Austin. Mostly he enjoys being an irreverent policy wonk and writing irreverent wonkish articles for The Rag Blog. Read more articles by Roger Baker on The Rag Blog.]


When driving began to “abate around 2000,” this was the year that saw the beginning of recession in May of that year. By January of 2001, the recession was well underway. Nine-Eleven followed which had a severe impact for the early part of the decade. Both contributed to reduced driving by the public.
By the end of 2004, oil prices were in an ever increasing spiral upwards approaching $2 per gallon as opposed to the less-than-dollar prices of 2000. Even I was seeking to reduce my fuel expenditures as I like to drive old cars. When I found a vintage 1983 Honda Civic FE that needed a “little work,” I was in hawg heaven. After a total $600 investment, I was driving a car that got 35mpg city and in the low forties on the highway as opposed to 18 city/24 highway in my old Studebaker.
That said, the trend is the same for most working folks most who lack the capacity to attack the problem as I did. Subsequently, their transportation costs are even higher which in turn robs the economy of discretionary cash. And I agree with Roger that car ownership is trending downward. But I question the “20% of the typical family budget” being expended on transportation costs. My own experience is about 10% and I do not budget carefully in this respect. Of course I have to again emphasize that my capital transportation costs are far lower than those of the average driver.
Roger’s thoughts regarding a shift to public transit by older folks and in tougher economic times, folks in general is a natural option. In older large cities, the options are much greater since most of the associated infrastructure was built over a hundred years ago. In cities like Austin, the cost/benefit ratio in my opinion is just not there. It then becomes a question on just how much can we afford as taxpayers?
And hybrid cars… Not in a million years as far as I’m concerned. Long term amortization costs never come out in a positive sense. Maybe a “feel good” sense but nothing practical. Any efficient gas power vehicle will prove to be the better investment. Now, if a manufacturer were to come out with a plug in electric car that had a range of two hundred miles or better, that might be something that I would consider.
In short, I believe that the marketplace will determine energy costs in the future and is the best way to proceed. The smarter and savvy folks will come out OK and the last thing we need is government interference…
This is just a rough spot. Things will be better once a miracle happens.
Roger Baker provides an impressive array of indicators of impact of high costs at the pump. And provides more support for recognizing that we are moving through a transition from auto-centered mode of transportation to more thoughtful urban transportation solutions, such as figuring ways to move people to jobs on light rail and street cars.
Roger’s article on less driving now makes those of us in favor of a just rationing system feel pressed for time as we see the people with lower incomes already becoming the largest group to take us in the right direction of less consumption, yet with no reward for it, which they could enjoy under rationing like Tradable Energy Quotas (TEQs).
Taxing, by itself –which is another name for any price increase– won’t work when limiting use is more important than potential revenue, as Australia has not yet figured out in taxing the top 500 polluters. Instead of requiring them to pay the tax, require them to buy (like bonds, on a central market) energy certificates from a nationally controlled supply, while at the same time giving a uniform allotment of them to every adult, who is free to reduce his/her use and sell the excess certificates in that market.
That’s the TEQs system we are studying here in Columbia, MO and should be sending this information to Australia. Any good contacts there?
Mary Lehmann