
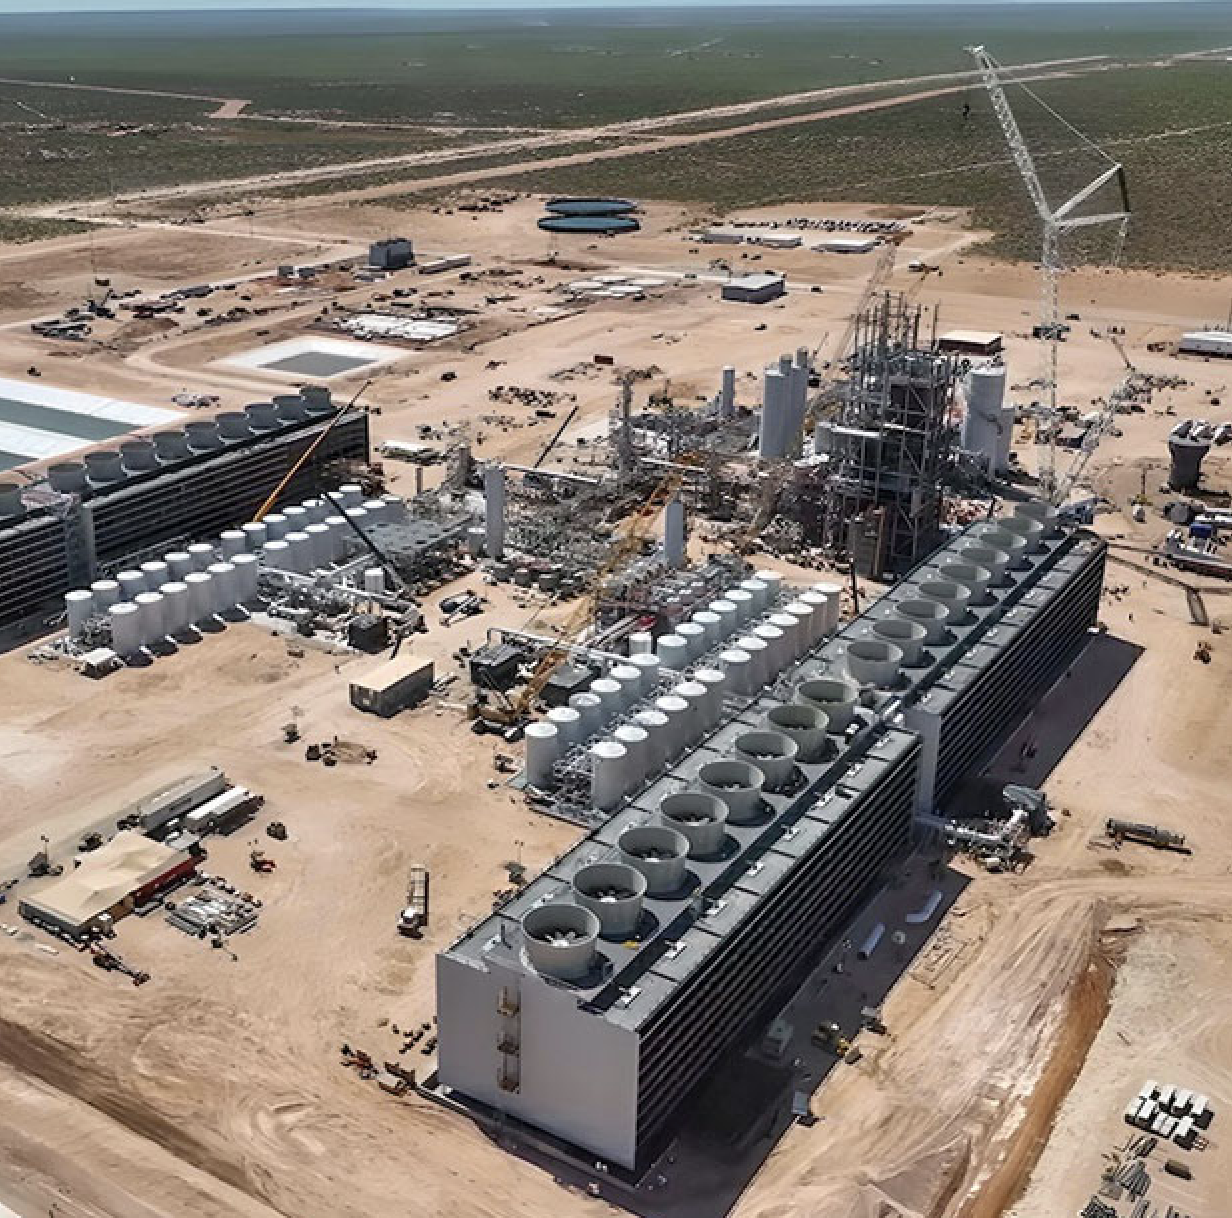
Occidental Chemicals CO2 air capture unit in the Permian Basin about to begin operations.
The Science of the Effects of Warming
By Bruce Melton / The Rag Blog / December 31, 2025
The good news is real, but a bit less in quantity than the bad news unfortunately. Our climate continues to crash, and the current U.S. administration continues to dismantle climate pollution regulations. The bad news first, then the good.
2025 SUMMARY
The global temperature jump in 2023 and 2024 has not significantly dissipated…
The 2025 temperature globally will be the second or third warmest after 2023 and 2024 that exceeded the dangerous 1.5 degree C threshold. El Nino was partially responsible, and the new global cooling sulfur limits in shipping fuels and China too, but the 0.5 degree C jump cannot be explained by these two things alone. Some say the rest is from a peak in the 11-year solar cycle, but this is only a few percent of total warming forcing. The Hunga Tonga eruption in 2022 put a record amount of water vapor in the stratosphere causing warming, but the net effect considering cooling from volcanic sulfates is now considered to be neutral. Less cooling cloud formation from fewer sulfates is also in the mix but this warming is included in the cooling from sulfur regulations in shipping fuels, China and etc.
What is missing is warming from increased natural greenhouse gas emissions from degrading and collapsing Earth systems like tropical forests and permafrost, and from less snow cover and alpine and arctic greening via trees growing up in tundra, sticking up above the snow where they can absorb sunlight and create nine times more warming than snow. In total, the near tripling of the warming rate seen in the last several years is not expected to diminish, ever, until we reduce greenhouse gas concentrations back to within the evolutionary boundaries of our world’s systems.
Rhode et al., October 2025 Temperature Update, Berkeley Earth, November 19, 2025.
https://berkeleyearth.org/october-2025-temperature-update/
2025 on course to be joint-second warmest year, with November third-warmest on record,
Copernicus Climate Service, December 9, 2025.
https://climate.copernicus.eu/copernicus-2025-course-be-joint-second-warmest-year-november-third-warmest-record
Hansen et al., Global Warming Has Accelerated Are the United Nations and the Public Well-
Informed, Environment, Science an Policy for Sustainable Dev, February 3, 2025.
https://www.tandfonline.com/doi/epdf/10.1080/00139157.2025.2434494?needAccess=true
Hausefather, Global Temperature Analysis: What are the causes of recent record-high global
temperatures? Carbon Brief, October 12, 2025.
https://www.carbonbrief.org/analysis-what-are-the-causes-of-recent-record-high-global-temperatures/?utm_source=substack&utm_medium=email
Near-future warming…
Warming is expected to continue its significant acceleration that began in the mid 20-teens with 2027 seeing 1.7 degrees C warming above normal. Hansen et al., Global Temperature in 2025, 2026, 2027, Columbia Climate School, December 18, 2025.
https://www.columbia.edu/~jeh1/mailings/2025/
GlobalTemperaturePrediction2025.12.18.pdf
Total Earth system sequestration has flipped from increasing to decreasing because of natural feedback emissions…
Natural sequestration of CO2 by our Earth systems has begun to decline. This marks a tipping point of extreme importance. Not only does it tell us that our natural systems are degraded, and that this degradation cannot be stopped unless we restore our climate’s temperature back to within the evolutionary boundaries of our Earth systems so they can self-restore, it tells us that climate change will now accelerate faster, even if human-caused emissions do not increase, because fewer greenhouse gases are being absorbed by Earth systems, creating more warming than from the emissions alone. Forest degradation from insects and disease across the world, declining ocean and soils absorption, and increased permafrost thaw have flipped Earth’s natural greenhouse gas sequestration systems from an increasing to a decreasing rate.
What this means is that, if our Earth systems were sequestering greenhouse gases at the same rate they did in the 1960s, the annual atmospheric growth rate would have been 1.9 ppm CO2 per year. Instead, the annual growth rate is 2.5 ppm CO2, and this is the 2010 to 2020 average. This decline is quite meaningful already at 0.25 Gt per year of lost CO2 sequestration and the increase will only increase further, and nonlinearly, as current feedbacks grow and new ones begin to emit. It is also very important to note that the decline will very likely be steeper than the increasing sequestration rate before the tipping point in 2008. This is because of feedbacks increasing in number as we warm farther away from the evolutionary boundaries of our old climate at about 1 degree C warming above normal, and increased warming almost always means nonlinearly faster and more extensive feedbacks.
Curran and Curran, Natural sequestration of carbon dioxide is in decline – climate change will
accelerate, Royal Meteorological Society, March 2025.
https://rmets.onlinelibrary.wiley.com/doi/10.1002/wea.7668
See also – Melton 2025, An Important Tipping Point for Our Total Earth System Has Passed – Natural Sequestration of Atmospheric CO2 Has Begun to Decline Natural sequestration of carbon dioxide is in decline: climate change will accelerate. Occidental Chemicals CO2 air capture unit in the Permian Basin about to begin operations.
Global carbon (greenhouse gas emissions) at risk from natural systems degradation (tipping)…
The Amazon contains 123 Gt carbon in above and below ground biomass, or 451 Gt carbon as CO2. Boreal forests hold over 1,000 gigatons of carbon or over 3,667 gigatons of carbon as CO2.
Permafrost holds about 1,400 gigatons of carbon or 5,133 gigatons carbon as CO2. From just these three Earth systems then, there is a risk of natural feedback emissions of 9,251 Gt carbon as CO2 and the total at risk from all the world’s boreal, temperate and tropical forest, soils and oceans is even more than this. Total human emissions from fossil fuels, agriculture, forests and other land uses and abuses were 725 Gt carbon from 1850 to 2024, or 2,656 Gt C as CO2. Therefore, there are easily 10 to 20 times more carbon emissions at risks from collapsing Earth systems than humans have emitted since 1850 and these emissions have now been initiated with the ongoing degradation of our Earth systems that are beyond their evolutionary boundaries.
TIPPING, AKA, EARTH SYSTEMS DEGRADATION AND FOREGONE COLLAPSE
The tipping conundrum continues to advance with almost no consideration of radically changed climate mitigation fundamentals…
Tipping, or Earth systems collapses, are now active in more than half of known tipping systems: Arctic sea ice, Greenland ice sheet, boreal forests, permafrost, the Gulf Stream, the Amazon, coral, the West Antarctic Ice Sheet and parts of the East Antarctic Ice Sheet. Tipping happens when a system’s evolutionary boundary conditions are exceeded and the system’s species and mechanisms collapse, so that new ones can evolve into a new system that is tolerant of the changed boundary conditions. This collapse often happens very abruptly with fire, insect and disease attacks, extreme water stress mortality from drought, and other acute changes to ecologies that are now far warmer than any time in their evolution. These collapses, or tippingresponses, have the capacity to release stored carbon in the form of greenhouse gases that dwarf humankind’s emissions. The existence of these tipping elements has been known for decades, but it is just since publishing in 2019 that activation of their collapses has been confirmed. Most of these tipping elements have the capacity to self-restore, but only if the warming effects are removed before the system’s degradation becomes so severe that the system cannot stabilize and collapse spirals out of control. This “point of no return” as it has been labelled, for most of the already activated tipping systems is about mid-century. Left unchecked, once degradation begins in about half of those systems already activated, their degradation cascades into other systems, creating faster and more extreme collapses of those other systems. New findings on systems’ tipping collapses are listed below:
Tropical forests…
Australian tropical forests and likely all tropical forests have flipped from sink to source. “The transition was driven by increasingly extreme temperature and other climate anomalies, which have increased tree mortality and associated biomass losses, with no evidence of the carbon fertilization (stimulation) of woody tree growth.”
Carle, Bauman et al., Aboveground biomass in Australian tropical forests now a net carbon source, Nature, October 15, 2025.
https://www.nature.com/articles/s41586-025-09497-8
Western U.S. forest flip from sequestration to emissions…
Eastern U.S. forest remain a carbon sink as of 2020 (it is questionable if they remain so today). Western U.S. forests though, have flipped from sequestering carbon to emitting it. Though not quantified, the authors show that persistent and increasingly extreme drought and fire, as well as simple water stress mortality, have all combined to flip western U.S. forests in general, from sequestering to emissions.
Hogan et al., Climate change determines the sign of productivity trends in US forests, PNAS, January 2024.
https://www.pnas.org/doi/10.1073/pnas.2311132121
Africa…
Africa has flipped from a carbon sink to a source, because of human-caused and natural forest degradation and mortality. This is not just tropical African forests, but the entire continent.
Rodriguez-Veiga et al., Loss of tropical moist broadleaf forest has turned Africa’s forests from a carbon sink into a source, Nature Scientific Reports, November 28, 2025.
https://www.nature.com/articles/s41598-025-27462-3
Oceans…
The Atlantic Meridional Overturning Circulation (AMOC), of which the Gulf Stream is a part, is now projected to shut down by 2050. The cause is increased polar ice melt and blocking of AMOC flow because of cool, freshwater pooling in the North Atlantic from Greenland and Outflow from the Arctic Ocean via the East Greenland Current. This projection assumes a stable temperature from today.
Hansen et al., Global Warming Has Accelerated Are the United Nations and the Public Well-Informed, Environment, Science an Policy for Sustainable Dev, February 3, 2025.
https://www.tandfonline.com/doi/epdf/10.1080/00139157.2025.2434494?needAccess=true
Ocean Acidification Flip…
Ocean acidification has proceeded to the point that the calcifying process that creates marine creature’s shells out of carbon dioxide is now degrading. About 60% of the global subsurface ocean (down to 200 m) and 40% of the global surface ocean has crossed this boundary into degradation with implications not only for corals and bivalves, but for primary productivity species (phytoplankton and etc.) that create more than half of the oxygen in our atmosphere. These changes result in significant declines in suitable habitats for important calcifying species, including 43% reduction in habitat for tropical and subtropical coral reefs, up to 61% for polar pteropods, and 13% for coastal bivalves.
Findlay et al., Ocean Acidification – Another Planetary Boundary Crossed, Global Change Biology, June 9, 2025.
https://onlinelibrary.wiley.com/doi/10.1111/gcb.70238
Antarctica…
Antarctic systems collapses are emerging. Antarctic sea ice has plummeted after slightly increasing for over three decades, where the area covered by arctic sea ice has abruptly fallen by nearly half, indicating what appears to be a very significant regime shift with multiple cascading feedbacks in ice systems and biologic communities.
Abram et al., Emerging evidence of abrupt changes in the Antarctic environment, Nature, August 21, 2025.
https://doddridge.me/publications/emerging-evidence-of-abrupt-changes-in-the-antarctic-environment/
Antarctic Sea Ice
Silvano et al., used satellite observations that detect ocean salinity, that show “a marked increase in surface salinity across the circumpolar Southern Ocean since 2015.” The increase is caused by a weakening of the halocline, which is similar to a thermocline where warmer and colder waters are separated by their different densities and mixing is poor. Thermoclines are evident in most water bodies and most obvious in freshwater lakes where just four or five down the water temperature drops dramatically. The decreasing freshness of surface waters in the Antarctic is cause by less formation of sea ice that produces very dense brine that sinks into the abyss allowing the remaining water to become less salty.
Silvano et al., Rising surface salinity and declining sea ice, A new Southern Ocean state revealed by satellites, PNAS, June 30, 2025.
https://www.pnas.org/doi/10.1073/pnas.2500440122
Antarctic and Greenland Ice Sheets
Ice loss from Greenland and Antarctica has quadrupled since 1990s. These findings conclude that we passed the tipping point of these two systems with warming of about 1 degree C above normal, where we are 1.5 degrees C above normal today. The authors state, “Here we synthesize multiple lines of evidence to show that +1.5 °C is too high and that even current climate forcing (+1.2 °C), if sustained, is likely to generate several meters of sea-level rise over the coming centuries, causing extensive loss and damage to coastal populations and challenging the implementation of adaptation measures. To avoid this requires a global mean temperature that is cooler than present and which we hypothesize to be closer to +1 °C above pre-industrial, possibly even lower, but further work is urgently required to more precisely determine a ‘safe limit’ for ice sheets.”
Stokes and Deconto, Warming of +1.5 degrees C is too high for polar ice sheets, Nature Communications, Earth and Environment, May 20, 2025.
https://www.nature.com/articles/s43247-025-02299-w
Svalbard Record Warmth in 2024 portends meltdown of Arctic glaciers and ice sheets…
In 2024, Svalbard experienced a 1,500-year heat event losing nearly half as much ice as Greenland per year. This amount of melt and berg discharge is projected to be a frequent occurrence in a few decades without climate restoration back to within the evolutionary boundaries of our ice sheets and glaciers. This ice loss exceeds the 2100 projected loss by about 70 percent. The authors conclude, “We suggest that the summer of 2024 in Svalbard serves as an analogue for the widespread meltdown of Arctic glaciers in a warmer world.”
Shuler et al., Svalbard’s 2024 record summer, An early view of Arctic glacier meltdown, PNAS, August 18, 2025.
https://pmc.ncbi.nlm.nih.gov/articles/PMC12403128/
Tropical and Boreal Forests…
The authors of these findings show that our commonly understood 1.5 degree C warming target, which is our current level of warming, risks unavoidable impacts, meaning that warming of 1.5 C is too high for our forests with risks of foregone collapse or tipping. The real trouble they say, is that our current climate culture does not recognize the risks of irreversible collapse once degradation has begun, without restoration to a stable state within the former evolutionary boundaries of the forests. Their abstract concludes, “The proximity of dieback risk thresholds to the bounds of the Paris Agreement global warming levels underscores the need for urgent action to mitigate climate change—and the risks of irreversible loss of an important ecosystem.”
Munday et al., Risks of unavoidable impacts on forests at 1.5 degrees C with and without overshoot, Nature Climate Change, May 12, 2025.
https://www.nature.com/articles/s41558-025-02327-9
Arctic tundra region flips from sequestration to emissions…
For two decades, warming meant more CO2 sequestration in the Arctic because of the CO2 fertilization effect and “arctic greening” where woody encroachment increased biomass in tundra regions when trees and shrubs began replacing the tundra ecology. Because of excess warming, permafrost thaw, insects, disease and fire, the Arctic tundra region has now flipped from sequestration to emissions of greenhouse gases.
Natali et al., Arctic Terrestrial Carbon Cycling, NOAA Arctic Report Card, December 2024.
https://arctic.noaa.gov/report-card/report-card-2024/arctic-terrestrial-carbon-cycling/
AEROSOL COOLING
Global cooling aerosol reductions have contributed to the increasing rate of warming…
Regulations for ship fuels, China, India, and Europe, that limit sulfur in fossil fuels are now coming in to focus as being a significant contributor to the recent global warming acceleration. The new regulations were created, similar to air pollution regulations in the western nations in the 1970s, because of seven to eight million deaths per year from respiratory disease related to the air pollution created by sulfur when burned. These regulations however do not consider
that reducing natural sulfur in fossil fuels creates more warming because of the elimination of the global cooling sulfates aerosols created when sulfur is burned.
Aerosol cooling understated by ten times…
Tropospheric (lower atmosphere) aerosols in pristine air over the oceans have a much greater cooling capacity than in polluted air over land. The reason is simple. In polluted air, where air pollution is far more predominant over land; this pollution includes dark aerosols, or dust and soot, that when struck by light energy, captures that light energy and warms, creating heat, where in the absence of these dark aerosols, the “bright aerosols,” or reflective aerosols like sulfates from burning sulfur in ship’s fuels, reflect light harmlessly back into space where it cannot strike something solid (like dark aerosols, or water, dirt, plants, etc., ) and turn into heat. IPCC’s modeling scenarios upon which almost all of our climate policy is based, do not yet recognize that aerosol cooling over the ocean is far more efficient than that over land.
Hansen et al., Global Warming Has Accelerated Are the United Nations and the Public Well-Informed, Environment, Science an Policy for Sustainable Dev, February 3, 2025.
https://www.tandfonline.com/doi/epdf/10.1080/00139157.2025.2434494?needAccess=true
East Asian sulfur regulations are causing an additional global warming feedback…
China’s efforts to stem harm from air pollution since the tremendous problems at the 2008 Olympics, has resulted in much cleaner air for the Chinese, but has also created what is plausibly a 0.05 degree C annual warming because of loss of global cooling sulfate emissions.
Samset et al., East Asian aerosol cleanup has likely contributed to the recent acceleration in global warming, Nature Communications and Environment, July 14, 2025.
https://www.nature.com/articles/s43247-025-02527-3
FEEDBACKS
Slow and fast feedbacks are what create most of the warming we experience, but they are sometimes slow relative to humans. It is the fast feedbacks that are worrisome.
Albedo feedback…
Sea ice is one of the most important global cooling systems of all. Ice reflects up to 90 percent of sunlight harmlessly back into space, but open water absorbs up to 90 percent of sunlight creating heat that is trapped in our atmosphere through the greenhouse effect. The results of the warming-caused reduction in sea ice then, creates a feedback of additional warming where globally, sea ice has lost about 15 percent of its cooling effect since the 1980s. This is about 20 percent of the total cooling effect of all of Earth’s cooling systems’ responses or about ten percent of total net warming.
Duspayev et al., Earth s Sea Ice Radiative Effect From 1980 to 2023, Geophysical Research
Letters, July 14, 2024.
https://agupubs.onlinelibrary.wiley.com/doi/full/10.1029/2024GL109608
Amazon record 2023 drought and the moisture feedback…
The most extreme drought in the Amazon yet, the fifth since 2005, where they have all been greater than the 100-year drought, was caused by atmospheric stability. This is an emerging forcing in warming effects called the drought feedback or heat feedback. Excessive warming creates a stable atmosphere and in this case, even with uncommonly high moisture in the atmosphere, rain was not created because of atmospheric stability created by the heat feedback. Instead, the moisture was simply transferred to downwind areas with greater instability, creating flooding in Uruguay/Brazilian-South-Atlantic-Marginal river basins in September-October of 2023.
Fernandez-Alvarez et al., Moisture and temperature sources were key drivers of the anomalies for the record-breaking of 2023 Amazon drought, Communications Earth and Environment,
October 9, 2025.
https://www.nature.com/articles/s43247-025-02771-7
Compound drought events in the Amazon…
The trend is now painfully obvious. Compound drought events are now being created in the Amazon. Degradation and forest mortality in the Amazon is closely tied to compound drought and heat waves, low-soil moisture and low humidity. These compound drought events have become far more frequent and severe since the turn of the century and have resulted in the Amazon becoming a net emitter of greenhouse gases instead of absorbing them. This work states, “The previous record compound event of 2015–2016 was particularly significant due to its ecological impacts. Therefore, the record-breaking compound drought and heat wave and lows soil moisture and humidity conditions in 2023–2024 are expected to have even more severe impacts.”
Ferreira et al., Evaluating the 2023–2024 record dry-hot conditions in the Amazon in the context of historical compound extremes, Environmental Research Letters, July 11, 2025.
HYDROLOGIC CYCLE IMPACTS
Rain machine and outsized effects on drought and precipitation in a warmer world…
The rain machine plays a critical role in not only the survival of forest ecologies but from downwind effects on other forests and ecologies. Drier ecological conditions brought on by nonlinearly increasing evaporation with warming, decreases ecological evaporation, leading to less rain or even conditions where there is more moisture in the atmosphere, but greater stability from warmer temperatures allowing less rain to fall. These conditions are not only amplified by warming, but greatly amplified by the increasing severity of extreme weather events. Longer, hotter droughts cause the rain machine to fail in a greater way and conversely, greater precipitation creates even greater atmospheric moisture locally, allowing even greater rainfall rates and quantities when triggering mechanisms are active.
Miralles et al., Vegetation–climate feedbacks across scales, Annals of the New York Academy of sciences, February 15, 2025.
https://pmc.ncbi.nlm.nih.gov/articles/PMC11829326/
Hydroclimate whiplash – from drought to flood and back again…
As of July 15 for the year 2025, the National Weather Service issued more flash flood warnings than any other year on record since their modern era of warnings went into effect in 1986. Simply put, a warmer climate creates longer and more extreme droughts, punctuated by more extreme rainfall events with greater rainfall intensities. It’s not just that a warmer atmosphere holds seven percent more water vapor for every degree C it warms, it’s the dynamic effects that count. Heat creates nonlinearly greater evaporation, increasing the intensity of droughts. The greater drought intensity limits evaporation, extending the drought in time. Greater heat also creates a more stable atmosphere so even if there is more moisture in the sky, atmospheric stability prevents rain from forming. With floods, when moisture condenses into clouds, heat is released, increasing the buoyancy of the moist air and causing it to rise faster, which increases condensation in a feedback loop. These dynamic effects create an increase in rainfall intensity of 20 to 30 percent total, adding to the increased rainfall from rare storms happening more frequently.
Alessi, “Hydroclimate Whiplash”: How Extreme Rainfall and Drought Are Linked, Union of concerned Scientists, (blog article), July 22, 2025.
Groundwater in the Colorado River Basin plummets…
The Colorado River Basin across the American West has been experiencing epic drought conditions for much of the last 20 years. These drought conditions are worsening, forcing greater reliance upon groundwater. This study used the GRACE satellite constellation, that can “see” groundwater because of the extra gravity it creates, to understand the depths of the groundwater losses as climate change-caused drought continues to intensify. What was found was that between 2003 and 2024, 52 cubic kilometers of groundwater was lost. This is 42
million acre feet, or nearly the volume of Lakes Mead and Powell combined, noting, that these
two reservoirs have not been above 30 million acre feet since 2005 and are currently at less than 20 million acre feet.
Abdelmohsen et al., Declining Freshwater Availability in the Colorado River Basin Threatens Sustainability of Its Critical Groundwater Supplies, Geophysical Research Letters, May 27, 2025.
https://agupubs.onlinelibrary.wiley.com/doi/10.1029/2025GL115593
Unprecedented continental drying, shrinking freshwater availability, and increasing land contributions to sea level rise…
“Mega-drying” regions are growing across the Northern Hemisphere by an area twice the size of California each year since 2002. Dry areas are now getting dryer faster than wet areas are getting wetter. Runoff from continents is now the greatest source of sea level rise surpassing that from ice sheets, mountain glaciers, and ocean warming expansion as individual contributors. Runoff is from over-pumping for human uses and excessive runoff from increased rainfall intensity, as well as excessive evaporation that eventually puts water in the oceans instead of it being stored on land.
Chandanpurkar et al., Unprecedented continental drying, shrinking freshwater availability, and increasing land contributions to sea level rise, Science Advances, July 25, 2025.
https://www.science.org/doi/10.1126/sciadv.adx0298
Warming accelerates global drought severity…
Historic drought was caused by lack of rainfall. With global warming, drought can now persist and strengthen with normal or even above normal rainfall. This is because of the nonlinear relationship between evaporation and heat. A little bit of warming does not create a little bit more evaporation, it creates a lot more. This increased evaporation effect is called atmospheric evaporative demand or AED, and it affects not only surface water, but soil water and plant
evapotranspiration. From 1901 to 2022, evaporative water demand has increased drought by 40 percent worldwide. Dry areas are becoming dryer and wet areas too, are experiencing drying trends. The authors of this piece tell us, “During the past 5 years (2018–2022), the areas in drought have expanded by 74% on average compared with 1981–2017, with AED contributing to 58% of this increase. The year 2022 was record-breaking, with 30% of the global land area affected by moderate and extreme droughts, 42% of which was attributed to increased AED.”
Gebrechorkos et al., Warming accelerates global drought severity, Nature, June 19, 2025.
https://www.nature.com/articles/s41586-025-09047-2
Half the world’s population experiencing double to 54 times as many extreme heat days as before we changed our climate…
Climate Central’s evaluation of our world’s countries hottest one out of ten days every summer shows that this heat has doubled in the U.S., but quadrupled in the south, south central and southwest. In Europe it is double, with eastern Europe quadruple. UK is up 150 percent. Countries closer to the equator, Barbados is ten time more: Bolivia eight times more, Congo – nine times, Cuba – five times, Ecuador – eight times, Ethiopia – eight times, Gaza – six times.
These are not cherry picked and represent my anecdotal selection. Northern latitudes are less, with only about a 50 percent increase. It is the island nations close to the equator that are the most extreme because of their more stable temperature in the middle of an ocean and, ocean warming… Cape Verde once per 10 days heat is now 15 times more than in our old climate. The Cocos Island are 50 times more. French Polynesia is 54 times more; Guam 37, the Maldives – 25 times, Micronesia 17 times, Northern Mariana Island is a whopping 174 times more days as hot or hotter than one out of 10 days each summer.
van Deelen, Climate Change Made Extreme Heat Days More Likely, EOS, the Journal of the American Geophysical Union, May 30, 2025.
https://eos.org/articles/climate-change-made-extreme-heat-days-more-likely
Based on research by Climate Central on May 29, 2025, Climate Change and the Escalation of Global Heat Extremes
https://www.climatecentral.org/report/climate-change-and-the-escalation-of-global-extreme-heat-2025
FIRE
Australia’s Black Summer…
Australia’s “Black Summer” wildfires in 2019 and 2020 were unprecedented, increasing Australian annual burn area by 800% relative to the 1988 to 2001 average. Extreme heat and drought caused widespread dieback of vegetation, increasing burn extremeness. Twenty percent of Australia’s temperate eucalyptus forests burned. The wildfires released about 0.75 gigatons of carbon dioxide, indicating a strong feedback to warming.
Prescribed burns can lessen the extreme outcomes of current climate change-caused wildfire, but this strategy comes at a price. More burns are now getting out of control. The largest wildfire in New Mexico history was from an out-of-control prescribed burn in 2022. Virtually the entire infrastructure of Grand Canyon National Park’s North Rim was burned in 2025 because of an out-of-control prescribed burn. In addition, a third of all wildfires since the
turn of the 21 st century are not regenerating and half of the remaining are only regenerating at 50 percent of the normal rate.
Bowman and Sharples, Taming the flame, from local to global extreme wildfires, Science, August 11, 2023.
https://www.science.org/doi/10.1126/science.adi8066
Warming increases wildfire ignitions…
Add another wildfire enhancement behavior because of climate change to the list. The drier and hotter it is, the easier it is for a spark to create a fire. In addition, drier and hotter weather creates more extreme burn behavior that is more difficult to extinguish, that continues burning through the night, and that creates less regeneration after the burn.
Wilson and Yebra, The Role of Climate in Ignition Frequency, Fire, May 10, 2023.
https://brcoe.org/wp-content/uploads/2024/04/The-role-of-climate-in-ignition-frequency-Fire-2023.pdf
Southwestern U.S. wildfires are less frequent, but more severe, creating a mortality feedback unprecedented in the tree ring record…
Looking at tree rings dating back to 1700, plus satellite burn severity and tree mortality across Arizona and New Mexico, the number of fires burning in a given year is only 20 percent of the pre-European average. However, the extremeness of these fires is nearly half again as extreme as pre-European wildfires. Implications are, say the authors, “At sites where trees historically survived many fires over centuries, 42% of recent fires resulted in high tree mortality.” This increased mortality has implications for the continued existence of forest as we knew them in our old climate.
McCLure et al., Contemporary fires are less frequent but more severe in dry conifer forests of the southwestern United States, Communications, Earth and Environment, October 11, 2024.
https://www.nature.com/articles/s43247-024-01686-z
SEA LEVEL RISE
Sea level rise acceleration – the rate has doubled in the last 30 years…
For the vast majority of the 20th century, sea level rise was between 1.2 and 1.5 mm per year. The around 1990 it jumped up to 2 mm per year then about 2000 it was 3 mm per year. Based on 2004 and 2009 data, sea level rise has increased to 3.4 to 3.7 mm per year. This work shows that the average sea level rise rate from 1993 to 2003 was 4.5 mm per year. The sea level rise rate has now changed from linear to nonlinear, with concerning implications for further warming.
Hamlington et al., The rate of global sea level rise doubled during the past three decades, nature Communications and Environment, October 17, 2024.
https://www.nature.com/articles/s43247-024-01761-5
See Also, Swain et al., Hydroclimate volatility on a warming Earth, Nature Earth and Environment, January 9, 2025.
https://www.nature.com/articles/s43017-024-00624-z
GOOD NEWS

The diamond ring emerges after the total eclipse in Georgetown, Texas, April 8, 2024.
Eclipses are great geoengineering experiments
The eclipse cooling phenomenon gives opportunity to study how geoengineering cooling affects our environment. When 15 percent of the sun is eclipsed, obvious cooling changes begin to happen beneath the shadow of the eclipse. This effect is what this new research is about. Cooling does more than just cool, it causes clouds to evaporate when heating is removed and upwelling air currents are reduced or reversed. Our personal viewing of the eclipse went from sporadic and very short views beneath cloud cover every three to five minutes, to zero clouds during totality. Much can be learned about geoengineering from eclipses. The cover image for this post was of the diamond ring effect just after totality in Georgetown, Texas.
Trees et al., Clouds dissipate quickly during solar eclipses as the land surface cools, Nature Communications – Earth and Environment, February 12, 2024.
https://www.nature.com/articles/s43247-024-01213-0
IRS 45Q Carbon Capture Incentive Alive and Well – Enhanced by U.S. Administration
The most important carbon capture tax and cash pay incentive in the world has been upheld bythe current U.S. administration and in some cases enhanced. Annually 61 million tons of CO2 are captured and safely stored, a drop in the bucket but Rome was not built in a day. The U.S. carbon capture incentive with IRS Section 45Q continues to lead the world in positive incentives for carbon capture and sequestration.
The bill maintains the 45Q tax credit for point-source capture at $85/ton and direct air capture (DAC) at $180/ton in dedicated geologic storage, preserves transferability, and keeps the inflation adjustment date of 2027 with a base index year of 2025. The tax credit now includes parity for the utilization of carbon dioxide (CO2). In this new bill, CO2 used or converted into valuable products or injected and geologically stored in a qualified enhanced oil recovery or natural gas recovery project site will qualify for the same dollar value credit as CO2 that is permanently sequestered in a dedicated geologic storage site.
U.S. Preserves and Increases 45Q Credit in “One Big Beautiful Bill Act,” Global CCS Institute, July 8, 2025.
https://www.globalccsinstitute.com/u-s-preserves-and-increases-45q-credit-in-one-big-beautiful-bill-act/
Major carbon capture cost assumption error in our climate culture…
It is widely cited that air capture of carbon dioxide is too expensive to be feasible at $600 to $1,000 per ton of captured CO2. There are numerous mistaken assumptions in this exorbitant number, but a new one has come to light in 2025. Hansen 2025 uses unrealistically high costs for carbon removal, “Carbon capture at the giga-tonscale does not exist; the estimated annual cost of CO2 extraction is now $2.2- 4.5 trillion dollars per year.” This number is referenced as being from Hansen 2018. First, of course something that does not exist, does not exist, yet. Before we went to the moon, we had never before gone to the moon. This concept that gigaton-scale carbon dioxide removal does not exist yet is meaningless. Before airplanes were invented, humans had never flown. Before electricity was invented, there were no electric lights. There are three major, 100-year old industrial processes that are widespread in industry with scalable components that are even more widespread, that are capable of scaling to the gigaton level –if, we are motivated enough to spend the money.
See the History of Carbon Dioxide Removal and Gigapeople, Gigachickens and Gigashoes, to understand the widespread nature of these three mature carbon dioxide removal processes
and also to better understand the capacity of our advanced civilization with 8 billion souls, to create hundreds of billions of many, many different things every year with costs far in excess of what it will cost to remove an appropriate amount of greenhouse gases from our atmosphere to restore our climate back to the evolutionary boundaries of our Earth systems so that their
collapses will stabilize.
The $2.2- 4.5 trillion dollar annual cost of capturing CO2 from the sky made by Hansen 2025 is caveated by this statement in Hansen 2025’s reference (Hansen 2018), “Finally, note that costs are often discussed in units of $/tC, where tC is tons of carbon. A ton of CO2 is 44/12 times heavier than a ton of C. Thus, the Keith study implies a removal cost of $451–$924/tC.” “The Keith study,” is Keith 2018, a groundbreaking report on the direct and indirect costs of removing CO2 from the sky with the recyclable lime/potash process, scaled from the Carbon
Engineering pilot CO2 removal project in Squamish, British Columbia. This process is one of the three 100-year old removal processes mentioned above. Keith 2018 does what few air capture processes do – they itemized all costs of the process and published them. They did this because of the widespread nature of the process that did not include proprietary trade secrets.
Almost all other air capture processes remain unpublished because of the plausibility of their “trade secrets” earning trillions of dollars in revenue. The error here, that created a cost estimate four times greater than reality, is that Keith 2018 did not produce their calculations as tons of carbon (tC) as Hansen 2025 suggested. They used tons CO2 (tCO2). Therefore costs are not $451–$924/tC, they are as stated throughout Keith 2018 at $92-232 tCO2. Importantly, Occidental Chemicals is basing five, million ton per year air capture units using the recyclable lime/potash process on Keith 2018, all to be operational by2030, with another 95 units committed under IRS Section 45Q’s carbon sequestration incentive.
In addition, Keith 2018 uses $0.03 kWh natural gas for energy which accounts for 87 percent of process costs. Today’s renewables at utility scale are less than $0.01 kWh and do not require an extra 10 percent removal to account for the greenhouse gases emitted when natural gas is used for energy, lowering costs to around $50 per ton CO2 captured. And one more… to the producer, like Occidental Chemicals that is using natural gas to power their removal process; the cost of natural gas is almost free — the wells have already been sunk, the pipelines, pumping stations, and dewatering and degasifying stations already built. This will substantially lower costs below $50 per ton CO2 captured.
Melton, History of Carbon Dioxide Removal, climate Change Now Initiative, 2023.
https://climatediscovery.org/History_of_Carbon_Dioxide_Removal_Draft.docx
Melton, Gigapeople, Gigachickens and Gigashoes, Climate Change Now Initiative, 2023.
Why our giga task of engineered cooling solutions will be nothing different than life on Earth every day.
https://climatediscovery.org/Gigapeople_Gigashoes_and_Gigachickens.docx
Hansen et al., Global Warming Has Accelerated Are the United Nations and the Public Well-Informed, Environment, Science an Policy for Sustainable Dev, February 3, 2025.
https://www.tandfonline.com/doi/epdf/10.1080/00139157.2025.2434494?needAccess=true
Hansen and Kharecha, Cost of Carbon Capture: Can Young People Bear the Burden?, Joule, August 15, 2018.
https://www.sciencedirect.com/science/article/pii/S2542435118303465
Near-Cryogenic Air Capture of CO2 for $68 ton
Direct air capture costs of $68 a ton when zeolites and metal organic framework molecules are integrated with the natural gas regasification process at near-cryogenic temperatures. A common theme referenced in direct air capture feasibility findings is “However, despite this broad consensus and its technical maturity, carbon capture and sequestration (CCS) has not yet been deployed on a scale commensurate with the ambitions articulated a decade ago.” This valid but wildly wrong statement does not recognize a truth, that there has been no positive or negative incentive (regulations or monetary incentive) to remove greenhouse gases from the sky, therefor implementation has not proceeded. This inference of infeasibility in academic work is harmful to society, fundamentally inaccurate, and it promotes the invalid concept of direct air capture infeasibility.
Kim et al., Near-Cryogenic Direct Air Capture using Adsorbents, Energy and Environmental
Science, June 24, 2025.
https://pubs.rsc.org/en/content/articlelanding/2025/ee/d5ee01473e
What’s next for carbon removal? Undue false and widespread pessimism in the popular press.
The first half of this article reflects the pessimistic artificial intelligence (AI) interpretation of the sector, that is based mostly on popular press that has caused our climate culture’s predisposition to think any climate pollution mitigation actions but elimination of dirty fossil fuels is a moral hazard. It is not based on the science and industry, but speculation about what is perceived to be a nascent and dangerous sector, with complications from: the carbon credit market that is dominated by natural systems sequestration, by no governance, by normal early market venture failures that are interpreted as failure of the sector, by poor understanding of the science that is scenario-based where those scenarios only address 1.5 C or warmer scenarios and time frames of 2100, and where mature, 100-year old atmospheric carbon removal processes are almost completely disregarded. These pieces almost completely ignore ongoing industrialization of these century-old processes, that are not nearly non-existent, but massive. Possibly the most important issue is that there is little financial incentive, positive or negative, to remove carbon from anywhere, much less the atmosphere. This last issue is critical in that, carbon credit fees do not support capital investment. At the scale required to be successful, massive capital investment is required because the vast majority of carbon that must be captured is from historic emissions, not the future. The carbon fees in the sector today are for future emissions almost exclusively. Apples and oranges are being compared. Failure of the carbon credit markets that are designed to address future emissions based on natural systems, cannot be compared to industrial processes that are designed to address climate pollution already in our sky.
One example will suffice in the limited space here: The lead of this article uses an obscure startup failure to set the tone for the piece, “The company, Running Tide, said it could sink enough kelp to the seafloor to sequester a billion tons of carbon dioxide by this year, according
to one of its early customers. Instead, the business shut down its operations last summer, marking the biggest bust to date in the nascent carbon removal sector. Its demise was the most obvious sign of growing troubles and dimming expectations for a space that has spawned
hundreds of startups over the last few years.”
This startup was likely a scam to begin with, but the article’s wording contends this is the way the sector is proceeding with no other discussion than the quote above. Running Tide raised millions with a scheme to grow kelp and sink it to the ocean floor to store its carbon, but to fulfill their obligations for the millions of dollars it raised in carbon fees, it was dumping lime-kiln dust coated woodchips in the North Atlantic. This type of biomass dump has little positive science behind it. And, wood chips float, for some time usually. Running Tide could not fulfill their obligation with their nascent process and they defaulted on their investors. This article telegraphs this single failure as a market failure – it was not, it was a scam to start with.
Temple, Companies have still drawn down only enough CO2 to cancel out a few hours of U.S. emissions. Here’s what it will take to really scale up the sector, MIT Technology Review,
October 24, 2025.
https://www-technologyreview.com.cdn.ampproject.org/
c/s/www.technologyreview.com/2025/10/24/1126478/whats-next-for-carbon-removal/amp/
[Bruce Melton is a professional engineer, environmental researcher, filmmaker, climate science education specialist, author, and director of the Climate Change Now Initiative founded in 2005. He has recently been involved in groundbreaking climate policy development where he was awarded a special achievement award by the Sierra Club. He is a regular contributor to The Rag Blog and Rag Radio.]


merci pour ces informations très utiles .ce site est passionnant .