
Climate change has undersized our world’s engineered infrastructure, and increased modern flood safety has created complacency in a flood world far different from the safe one we recently vacated.

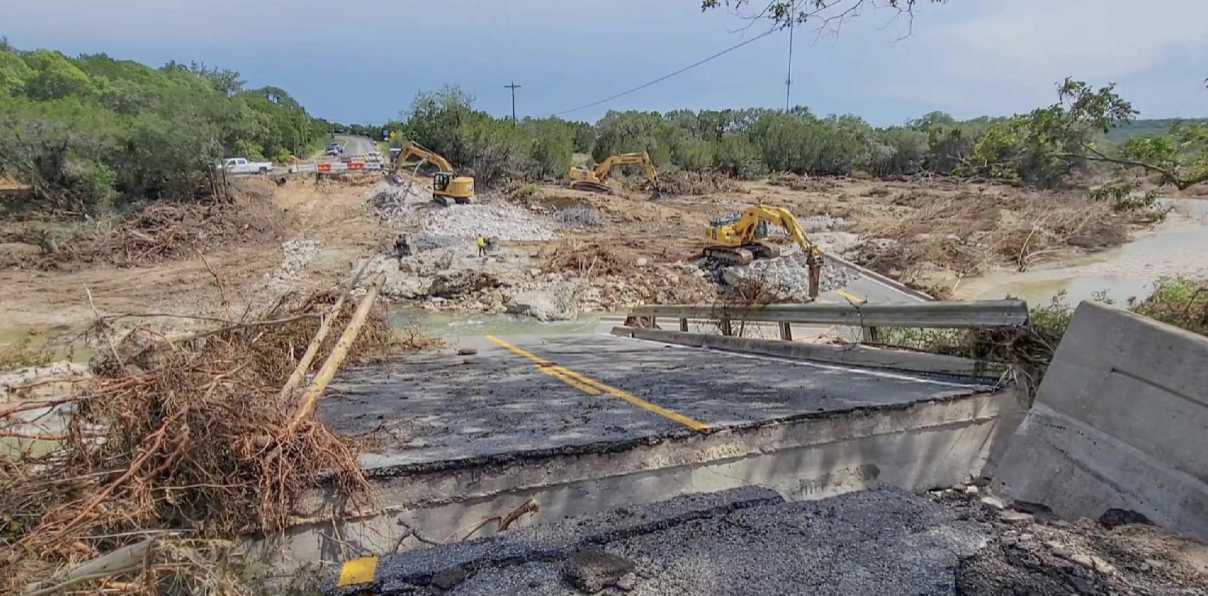
Caption: Cow Creek and what was Texas State Highway 1431, just northwest ofAustin, 70 miles northeast of Kerrville, 24 hours after the Kerrville tragedy in a completely separate rain event, after 13.3 inches of rain fell in the mountainous Hill Country of Central Texas, in three hours, with 17 fatalities and 5 still missing. Image: Bruce Melton
By Bruce Melton / The Rag Blog / July 31, 2025
Repeatedly unprecedented weather events are not “acts of God,” in the context used to describe the Kerrville flood tragedy on July 4. They are not a “new normal,” because we are still warming rapidly and every little bit of warming creates a lot more extremeness because of the basics of physics and energy where a little more heat does not create a little more energy, it nonlinearly creates a lot more energy, that is then translated into nonlinearly more extreme weather. This process is ongoing, so there is nothing “normal” about weather today as it keeps on getting a lot more extreme with further warming.
Even if we were to magically halt all warming this instant and stabilize our climate at today’s temperature, the extremes would continue to automatically increase. This is because in this new “magically stabilized” climate we have only been warmer than the weather created in our old climate for five to 10 years. Therefor it is likely that only the most frequent events today in our currently warmed climate, are the 2-, 5- and maybe the 10-year storm. As time passes, wewill automatically have to endure rarer and much more extreme events like the 25-, 50-, and 100-year storms.
We have warmed our climate beyond its natural variation. This means the temperature today is warmer than the evolutionary boundaries of our Earth systems. These systems are our forests, ocean currents, ice sheets, permafrost, etc. These evolutionary boundary rules are the same for almost any system: once crossed, stress creates degradation that if not stopped by removing the thing that caused the degradation to begin (warming effects) the results are the loss of many or all of the species and mechanisms in the system so they can be replaced by a new system with new species and mechanisms that are tolerant of the new conditions.
Some systems, like our hydrologic system that is typically known as the hydrologic cycle, are a little different and vastly more important. Our hydrologic system is the rain machine that creates our food and gives us water — the basics of life. Our hydrologic system is also vitally important in creating clouds. Different clouds cool by shading, or they warm like a blanket.
Changes in the types of clouds disrupt the balance of cloud cooling by reflecting sunlight harmlessly back into space, and warming by allowing sunlight to strike the ground, oceans of plants that changes that sunlight into heat where it can be trapped by the greenhouse effect.
A warmer atmosphere holds more moisture – nonlinearly more according to the laws of heat. Atmospheric moisture or water vapor, is the biggest greenhouse gas, responsible for two to three times the warming of carbon dioxide depending on the response of clouds. Water vapor however is not a greenhouse gas that we can control because it is directly related to evaporation of water from oceans, soils, and vegetation based on the temperature. The interplay of moisture in clouds is vital to our climate. A warmer climate creates fewer clouds that allows more sunlight to be absorbed by Earth systems creating more warming that then enters a feedback loop that allows even more moisture capacity in the atmosphere.
Each degree C (about 1.7 degrees F) warming allows the atmosphere to carry about seven percent more moisture. This alone allows weather systems to create seven percent more precipitation, but it doesn’t stop there. Dynamic effects (increase convection or rising water vapor in clouds) further increase rainfall. Hurricane Harvey for example, produced 32 percent more rainfall than an identical storm in the absence of global warming.
Warming amplifies the effects of the hydrologic system with significantly increased rainfall intensity (inches per hour of rain) and more extreme and longer-lived drought. Our climate’s temperature is warmer than any time in the last 10,000 years since the end of the last ice age, or really, since before the beginning of the last ice age pulse 100,000 years ago. Rainfall extremes therefore, are greater than any time our engineers have been designing stormwaterinfrastructure: since Roman times; since the Chen Dynasty.
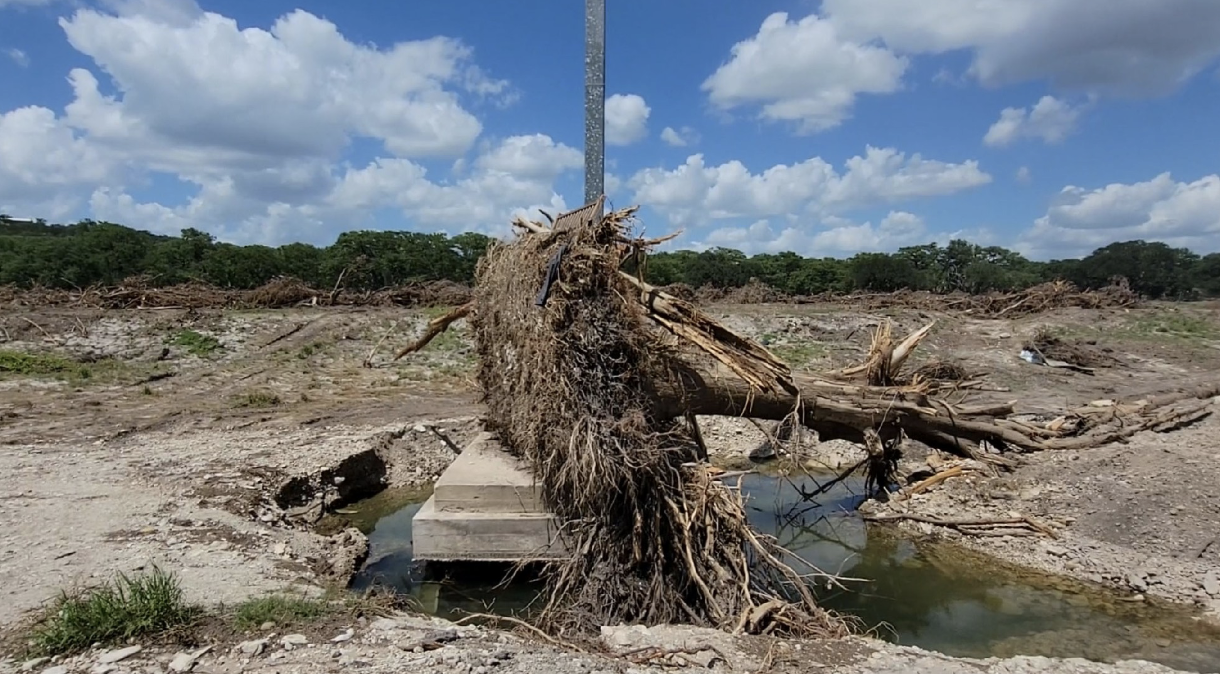
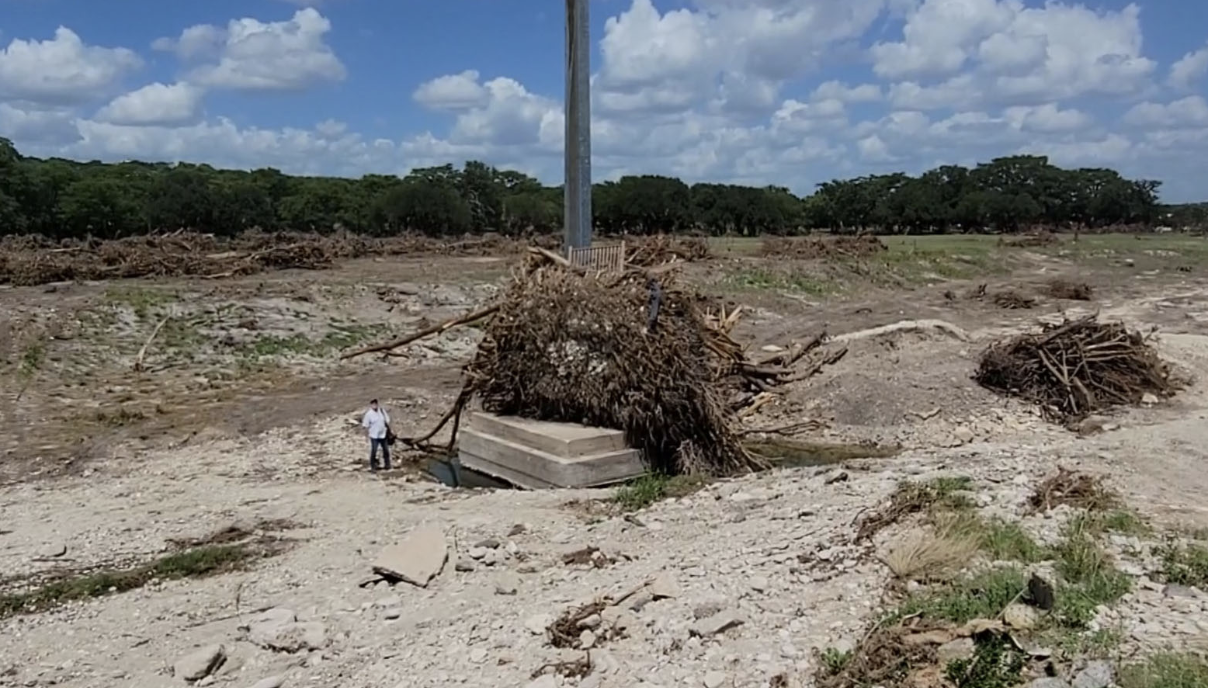
Caption: A Cypress, maybe 1,000 years old, as big as a giant sequoia, lodged against a
transmission tower in a large bend of the Guadalupe River, just downstream from Hunt. There
is a section of deck railing leaning against the transmission tower on top of the root ball. This
area is an overflow channel that cuts across the bend during major floods. The river channel is
600 feet away, behind the transmission tower, where the long line of green cypress are located.
This area was tree and brush covered before the flood. Location:
https://maps.app.goo.gl/6Ah3jrKUfrrojiZ76
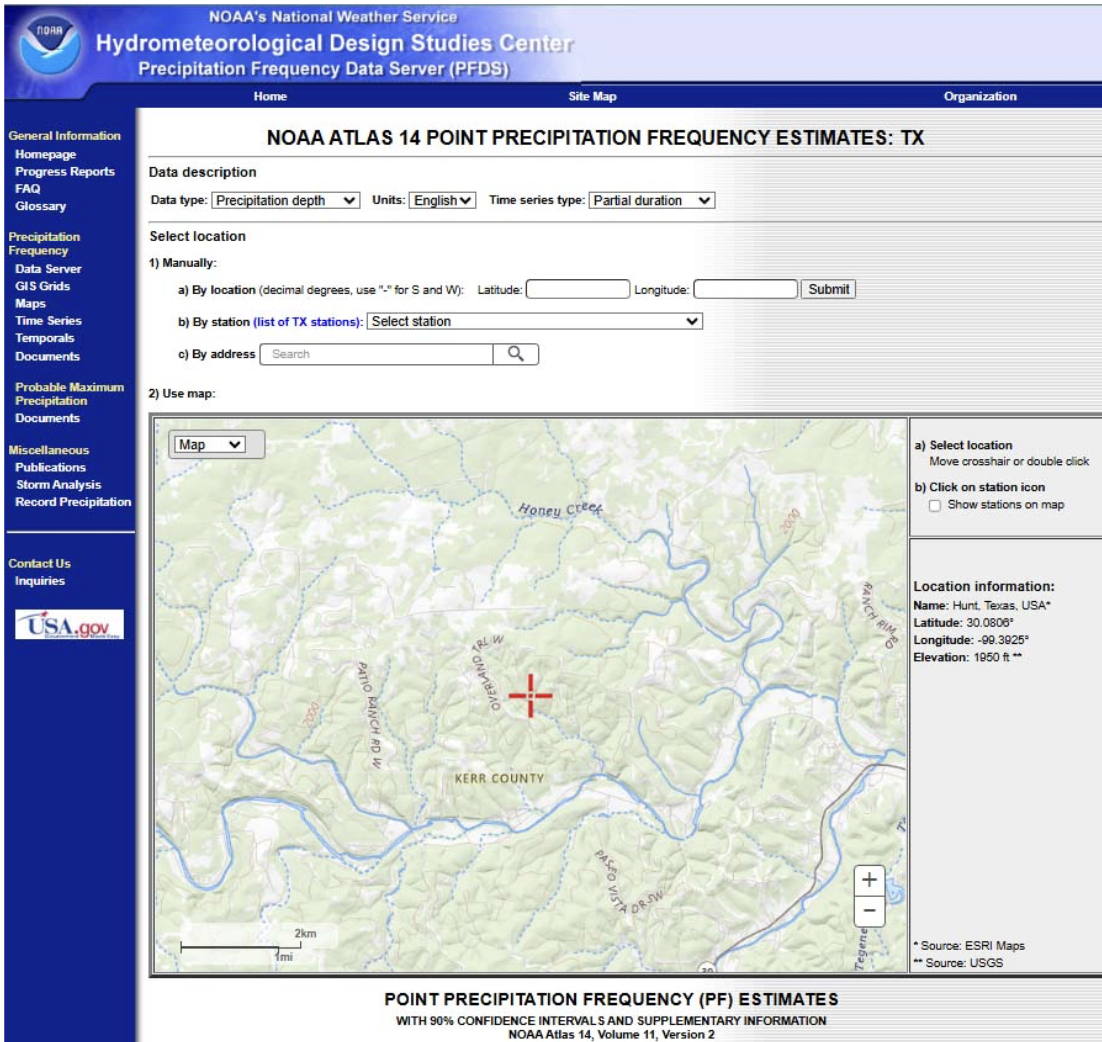
Because of these changes to our hydrologic system, the National Oceanic and Atmospheric Administration’s (NOAA) flood design criteria for new or rebuilt flood infrastructure are now significantly understated. The Federal Emergency Management Administration’s (FEMA) floodplains are based on rainfall intensity. The increased rainfall intensity increases flood volume. NOAA has been working on successor documentation to their current Atlas 14 Precipitation Frequency Evaluations that provide engineers the criteria to safely design our culture’s infrastructure to pass floods without harm to design our built infrastructure so that we are safe from flooding.
The Trump administration, in addition to eviscerating the National Weather Service, NOAA weather research, and FEMA, where FEMA is responsible for the lion’s share of funding and resources to plan flood plains and recover after flood events, this brain donor has now “delayed” the completion of work on NOAA’s new Atlas 15. Atlas 15 was supposed to not only update parts of the country that have been a generation of more since their last rainfall intensity evaluation, but to provide a Volume 2 of Atlas 15 that was forward looking, providing engineers and flood planners with increased rainfall intensity designguidance on a further warmed planet with further nonlinearly increasing rainfall intensity.
Repeatedly unprecedented extreme weather events, while they may technically be “acts of God,” have been produced by humankind-caused warming of our climate, through the emissions of climate pollution from burning fossil fuels and from land use changes and abuses.
The Texas floods, and other repeatedly unprecedented floods across the nation and the world, have been creating tragedy after tragedy that are much more extreme than historic tragedies from our old climate. These floods have broken all-time records again and again. The Kerrville tragedy flood was a 100-year flood according to FEMA’s dated floodplain mapping, last updated in 2011, but the relatively isolated rainfall that created the tragedy was a 2,500-year storm. The rainfall bullseye that created the Cow Creek flood in Travis, Williamson, and Burnet Counties was a 3,500-year storm. These extraordinary rainfalls, like the other thousand+ year events that
are way too common in the news, were created by human-caused warming and a warmer atmosphere’s ability to hold and precipitate more moisture.
The Copernicus European Space Agency global temperature in 2024 was 1.5 degrees C above normal from 1850 to 1900. Berkeley Earth was 1.62 degrees C warmer. In 2010 when data acquisition was halted for the 2010 FEMA flood plain updates, our climate’s temperature was about 1 degree C above normal. Since FEMA updated their flood plains, our climate has warmed more than half as much as it warmed previous to 2011, all the way back to the 19th century.
These flood tragedies are not just the result of our flood protection infrastructure now being undersized. They have been caused by complacency of our culture as our engineers have created much greater safety for citizens than was afforded in the past. This new-found safety has allowed us to minimize self-preservation behaviors, relative to our level of awareness of threats in the past, before our engineers and planners created the technology and cultural behaviors that have increased safety by such large margins today. Our engineering design criteria we use to keep us safe were developed in a climate that is definitively not our climate today. Warming matters to engineering. Today’s cultural/engineering and other safeguards that protect us, our families and property, are now significantly compromised.
I filmed the Big Sandy Flood on July 9, just northwest of Austin, with 18 fatalities and 4 still missing as of the writing of this article. The rainfall that created this flood on Big Sandy Creek, Cow Creek, and the San Gabriel River between Leander and Burnet and Marble falls early in the morning of July 5, 24 hours after the Kerrville tragedy, was about 15 percent bigger than the reports from Kerrville.
Any other time, the Big Sandy flood would be the top story for days across the country. But, the Kerrville region’s event with 107 fatalities, may the Great Spirit watch over us all, has allowed the Big Sandy flood to become a footnote. Between 1959 to 2019, there were 1,069 flood fatalities in Texas. The July 4-5 event toll is at 135, with 8 still missing.
Even with far better building codes, warnings, flood planning and a population that has more than tripled since 1959, the Texas floods on July 4 and 5 stand alone. The only ones similar were the 1913 and 1921 Texas floods caused by dying hurricanes and the Galveston flood of 1900 that killed 10,000 during a Category 4 hurricane in a time where there were no protective building codes and meteorological forecasts for hurricanes were hardly in their infancy.
While the July 4 and 5 floods were seeded by a long dead tropical wave, the flooding magnitude was because of increased moisture in the atmosphere, increased dynamic effects from warming, and a stationary weather pattern, all caused by climate warming. Galveston island’s highest elevation during the 1900 Hurricane was eight feet above sea level and after the storm, a 17-foot high, 3-mile-long seawall was built and 500 city blocks and every structure therein was raised up to 17 feet higher than their pre-storm elevation. The 1913 and 1921 events each created around 200 fatalities, also in a time when building codes, warning systems, flood plain regulation, and emergency behaviors were nearly non-existent, and both were caused by dying hurricanes.
Building codes today are far, far better than in the past. NOAA’s severe weather warnings were started in 1952, but weather radio broadcasts did not become widespread across the U.S. until the mid-1970s. The federal Emergency Management Administration (FEMA) did not start regulating floodplains until 1968. These things, along with flood aware planning and increased emergency behavior awareness, have helped create a far safer world from flooding, until our climate began changing. Today we are in the midst of a new world of weather extremes because of climate warming. Because the last five to 10 years of warming has now significantly exceeded the natural variation of our old climate, we have just begun to seriously be impacted
by the real-world effects of warming, but this message is compromised by the media and scientists that tell us this or that weather tragedy was made some percentage more likely because of climate change. While these are valid statements, they can also be misleading.
There remains with these statements, some probability the events were not caused by climate warming and therefore somehow, they don’t count. Add to this the tendency of media to report on both sides of the climate warming story, where one side is false, and these things create confusion among citizens that leads to less awareness of the risks of warming and delay of action that could save their live or the lives of others.
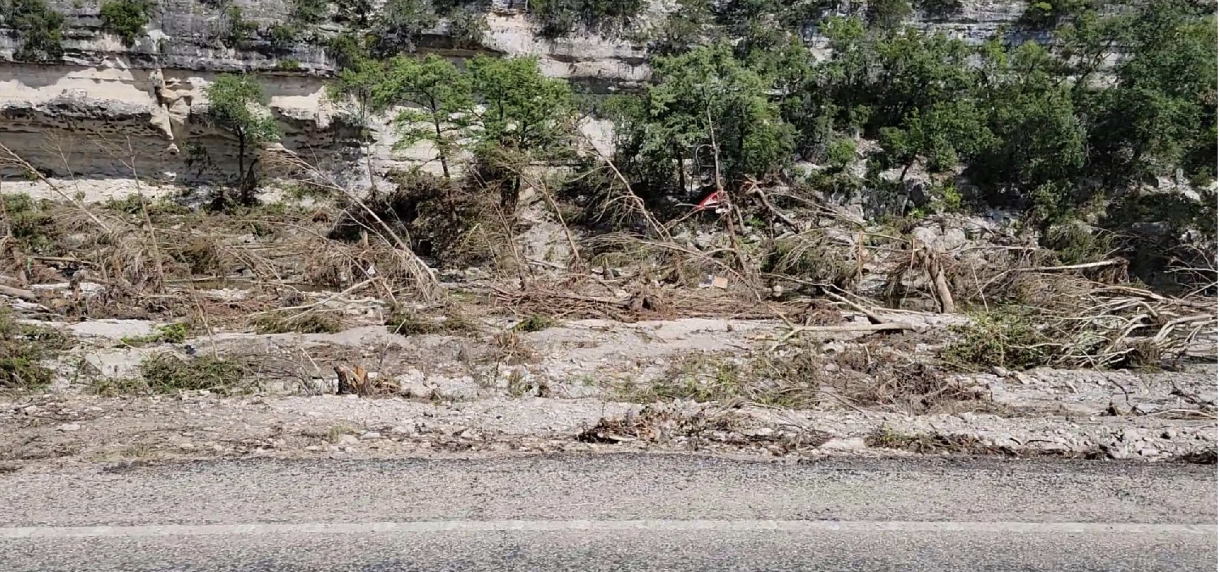
Caption: A lone canoe stuck high in a cypress in the Guadalupe River. Areas like these were entirely forested before the flood.
Our modern world is now far safer than back in the day, at least it was before our climate warmed beyond anything in at least 100,000 years. It is very important to understand just how much safety our engineers have created for us.
Tornado deaths in the early 1900s were 12 to 17 times greater per capita than today. Per capita mortality and economic losses from global weather and climate-related disasters were 6.5 and five times greater per capita in 1980 versus 2016. Flooding mortality in 1975 globally was double what it is today. The number of disasters has increased by a factor of 7 since 1960, where these are 83 percent climate and weather related, and fatalities have not been increasing, but decreasing since 2000. This is because of further life-saving improvements in infrastructure, planning and warnings.
Catastrophes do not happen unless thresholds are crossed. The thresholds that are creating unprecedented tragedies today in our significantly warmed climate, have crossed critical engineering, planning, and awareness thresholds, where in almost all instances these thresholds would not have been crossed in our old climate.
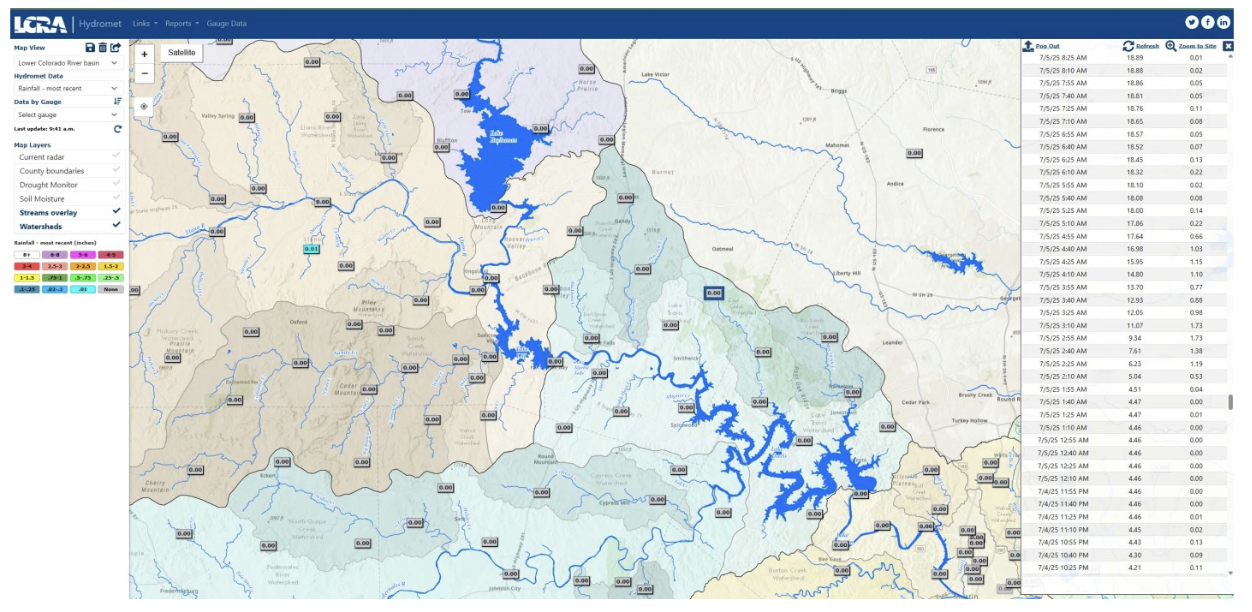
Our observations of the Sandy Creek flood were limited to Cow Creek, the drainage west of Sandy a few miles. The LCRA Hydromet weather stations in the area shows the Big Sandy Station lower down in the watershed where the fatalities occurred, was compromised and the gauge at the Leander 5 W Station in the headwaters of Sandy showed only about 6″ in about three hours. On Cow Creek, the two downstream gauges show about 10 inches about in three hours. It’s the headwater gauge on Cow Creek, (LCRA’s Bertram Station) that captures the significance of this event with 13.3 inches in three hours, and six inches in 1 hour. The reports from Kerrville show a bit less than 12 inches of rain in over four hours.
The actual storm cells that created the tragedies were very limited in size, but these limits don’t really matter to those who perished. Comparing their areail extent to the 1913 and 1921 hurricanes flood tragedies across Texas, their footprints are miniscule. Compared to Hurricane Harvey, they are almost non-existent. The toll in human lives however, was far from nonexistent.
We filmed Kerrville Monday the 21st of July. I have filmed more than 150,000 miles of climate change-caused effects across North America; mountain ranges of forest decimated by native insects; coastal forests obliterated by salt water poisoning from sea level rise and beaches removed from the face of the earth by the same rise; our national treasures destroyed by both insects and fire. Over 13,000 mature sequoias were killed by fire in California, almost all of them in the historic fires of 2020 and 2021. This was over 17 percent of all of the 75,500 known mature sequoias. In history, back a thousand years or more before Europeans, only several hundred sequoias died. Most of these were killed by gravity — they simple fell over, Sequoias
are more permanent than geology.
The effects of warming on the built environment and humanity, these are hard. Effects to the natural world are natural. We caused them with climate change of course but nonetheless they are natural. Things like these happen to our natural world every time our climate changes abruptly. The last time was about 10,000 years ago. But, the impacts to humanity are completely different. The sorrow is unimaginable. And then the joy, so out of place with all the sorrow; the joy of a thousand volunteers coming together to help, from all over the United States, Mexico and Canada, and from as far away as Israel and Czechoslovakia. Humankind is good. Love remains.

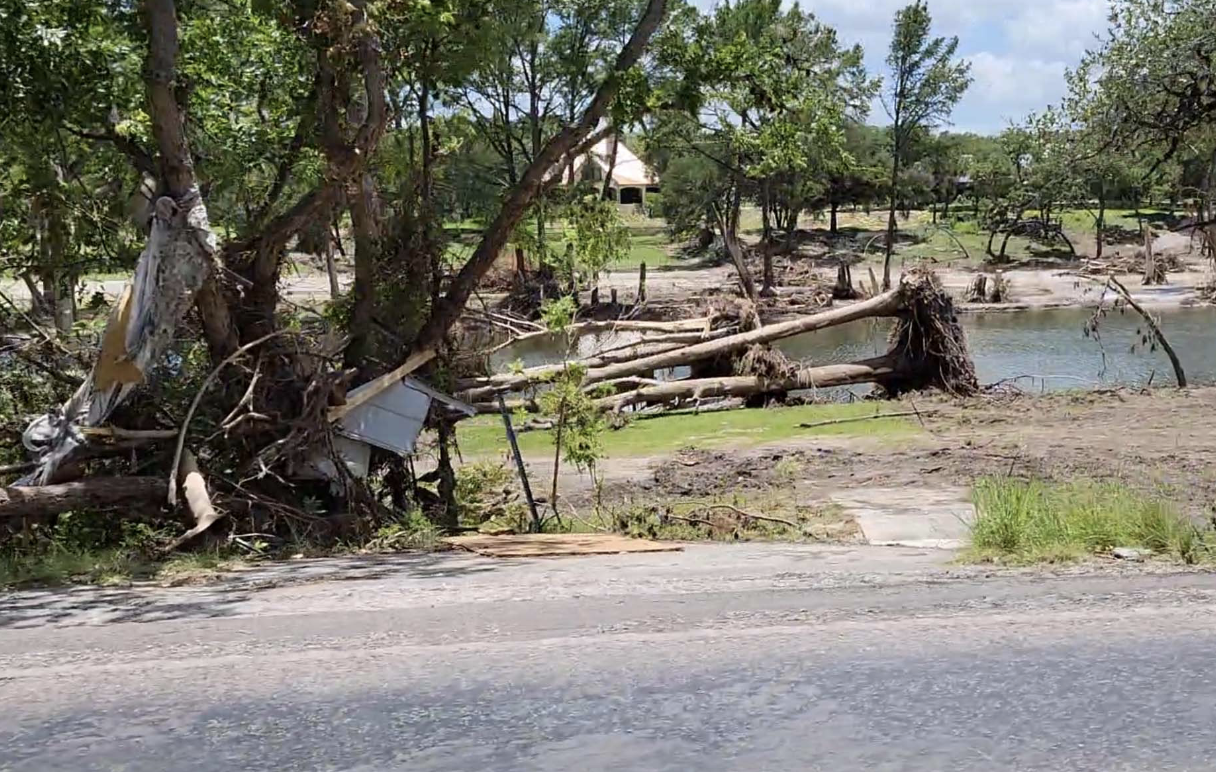
Caption: A collapsed building sits behind a road lined with mucked-out flood debris.
The 13.3 inches in three hours on Cow Creek is about a 3,500-year storm as per NOAA Atlas 14 for Texas rainfall intensity guidance for engineers that includes some, but not nearly all climate warming. Atlas 14 for Texas was adopted in 2018, the first change in rainfall intensity design criteria in Texas since 1961. The new evaluation of rainfall data show that, in a broad band of mostly coastal Texas extending 200 miles inland, the 100-year storm is now the 25-year storm. That is, the storm that happened once every hundred years on average over very long time periods in our old climate, now happens on average every 25 years… Be warned however, this revelation of the effects of warming on rainfall intensity is not even the most meaningful reality of our rapidly warming climate as it relates to the hydrologic cycle system.
There are four understating issues with these new NOAA engineering criteria for flooding.
1) Nonstationary data… The common “frequentist” statistics NOAA used to evaluate rainfall data is only valid if the data are stationary, or not moving. Because intensity is increasing with warming, the data are moving. Cheng and AghaKouchak 2014 says that considering the data to be stationary like NOAA admits they did in their process description of Atlas 14, causes an understating error of up to 60 percent. To understand this “non-stationarity” issue, think of an average of 100 years of data, where for 90 years the data were all about the same, and the last 10 years the data increased markedly with the largest increase in the last five years. When all of this data is averaged together, the recent increase in rainfall intensity is averaged in with the long-term rainfall intensities that were all about the same, significantly reducing the effects of the increase. This is why Atlas 14 is understated, or intensities are actually up to 60 percent greater than what Atlas 14 says. Because the Atlas 14 data for Texas are rapidly changing at the very end of the rain gauge data, it is likely that Atlas 14’s work is understated near the maximum of Cheng and AghaKouchak’s 60 percent.
2) Dated Data with Atlas 14… Data for Atlas 14 stopped in 2017. Since 2017 we have seen a very significant rate of increase in warming where we have warmed a third as much as we warmed in the previous 150+ years, with this further warming creating nonlinearly more rainfall intensity.
3) Only recently warmed beyond the rainfall intensity of our cooler climate… We just warmed above the maximum average natural variation of global temperature of about 1 degree C warming since the mid- and late-1800s in the last 5 to 10 years, so it is likely that only high frequency or relatively common events have occurred since, like the 10-, 5- and 2-year rainfall events, and etc. As time passes it will become more likely that less frequent and significantly more extreme events will occur, like the 25-, 50- and 100-year events. Important! This is if we could magically halt all warming this instant. Less frequent (rarer) weather events only happen (in general) with longer time frames, much longer than the 10 or fewer years since we warmed above the natural variation of our old climate.
4) Atlas 14 is backwards looking… Because Atlas 14 is based on historic rainfall data, it does include future increases in rainfall intensity after 2017, where warming creates nonlinearly more rainfall intensity.
Case Study – The Leander Flood Study, 2021… The City of Leander contracted K Frieze Associates to evaluate NOAA’s Atlas 14 in their region’s watersheds and found a +/- 50 percent increase in flood volume because of increased rainfall intensity due to warming.
So, what is NOAA doing about this urgent understatement in their flood engineering design criteria? John Nielsen-Gammon, the Texas State Climatologist, told me that NOAA is working on high-powered statistics to better represent Atlas 14’s engineering flood design criteria, and it will likely be some time yet before these strategies are published. Importantly, even high-powered statistics cannot robustly evaluate a moving target. Future work by NOAA will certainly help, but the underlying nature of an unknown rate of increase of rainfall intensity cannot be overlooked.
These things are of great cultural significance, but they are little known and poorly included in our lives because of the momentum of the past and a mindset that too, comes from the past. Before our climate warmed, our engineers and planners had very definitive norms from which to make professional decisions about the safety of our built infrastructure and our behaviors in extreme events. Disrupting the status quo with such an important mission as the safety of humanity in a changed climate, so as to address something that has never happened to us as a culture, where we have no historical behaviors from which to create future behaviors, is a global challenge to say the least.
Below are some statistics on the floods in the Big Sandy and Kerrville areas. Please understand that these statistics are a simple snapshot of data at very specific geographic locations. The conditions that created these flood tragedies may vary from these statistics, but these are all we have so far, to help us understand why these tragedies happened and the additional extremeness beyond our historic climate that resulted.
About 50 mile of Guadalupe River were devastated.
A few notes on how land forms affect flood extremeness… Headwaters flood enhancement… Headwaters are the very upper portions of watersheds where streams first appear out of flat terrain. Headwaters in steep terrain are particularly conducive to creating larger flood waves than flatter terrain. A flood wave is what hydrologist call the rapidly increasing water level of a flood as it moves downstream in what are usually identified as flash floods. In rare instances, a literal wall of water feet or more high can crash down a streambed, but generally a flash flood rise takes tens of minutes, still leaving precious little time to flee. The reason headwaters create larger flood waves is that most headwaters consist of branching networks of tributaries that join together in close proximity to create a named stream. This branching and the proximity of their convergences, along with the increased runoff and high flow velocities associated with higher slopes, creates a flood wave that is usually greater than a similar flood wave created by a similar storm further downstream where tributaries’ junctions with the main stream are more spread out. It appears that Kerrville and the Cow Creek events both originated in headwaters.
Another geographic consideration is the direction the stream flows and the direction the storm moves. If the storm moves in the same direction as stream flow, runoff from tributaries can enter the main stream as the flood wave passes downstream, increasing the flood wave height. Whereas if the storm is moving in the opposite direction from stream flow, the flood wave generally passes the mouths of tributaries along the main stream before the flood wave from the tributary reaches the main stream. A radar movie of the Kerrville storm shows it was moving in the same direction as stream flow. The Big Sandy storm appears to have been caused just by extreme rainfall intensity, steep rocky soils, and the headwater effect.
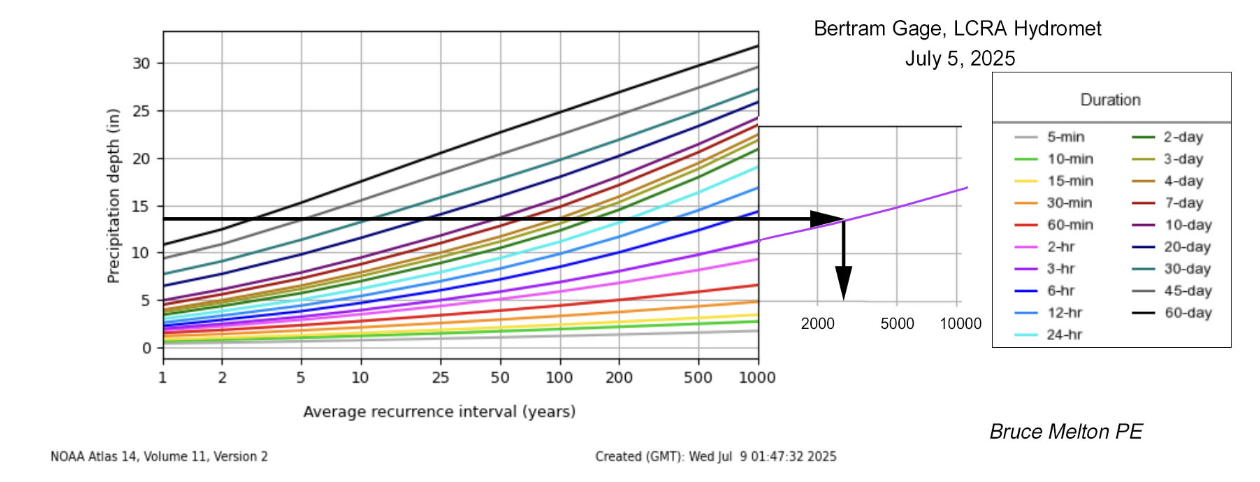
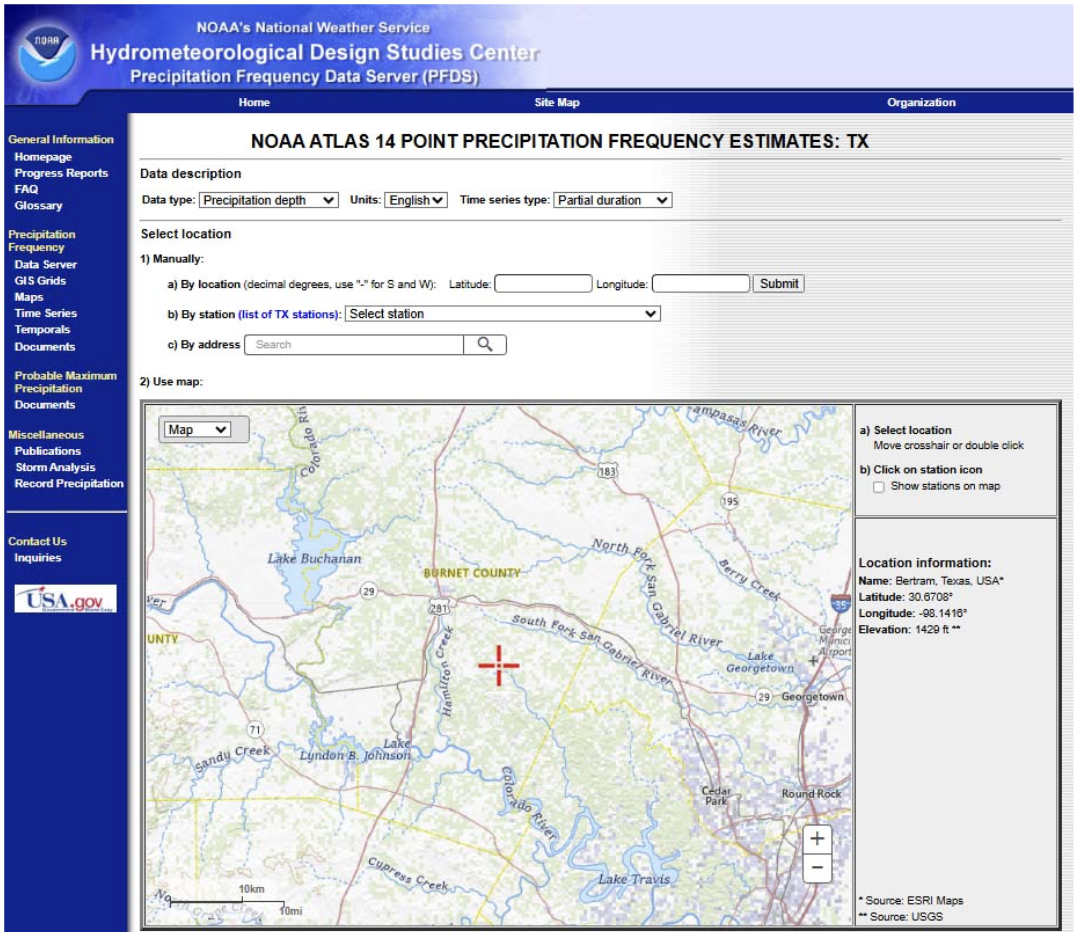
Bertram Gauge Location, (Lower Colorado River Authority (LCRA) Hydromet (Big Sandy Area Flood)
3-hour statistics
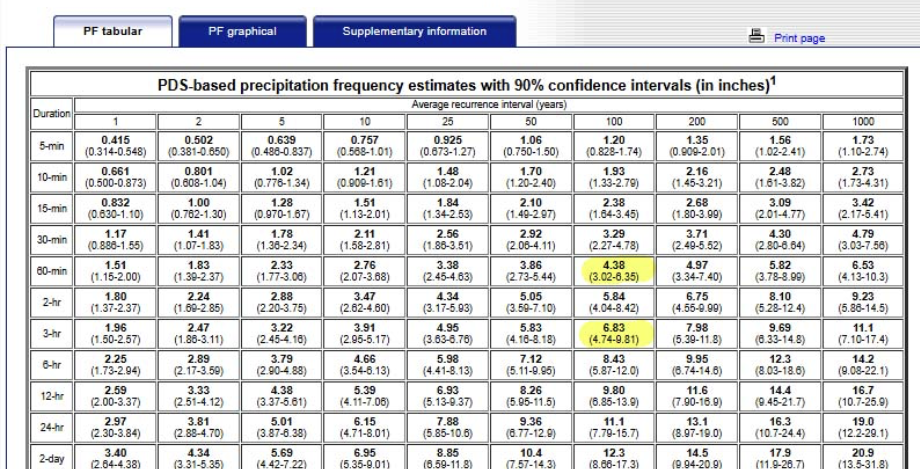
LCRA Hydromet, Bertram gauge, July 5, 2025 13.3 inches in 3:00 hours
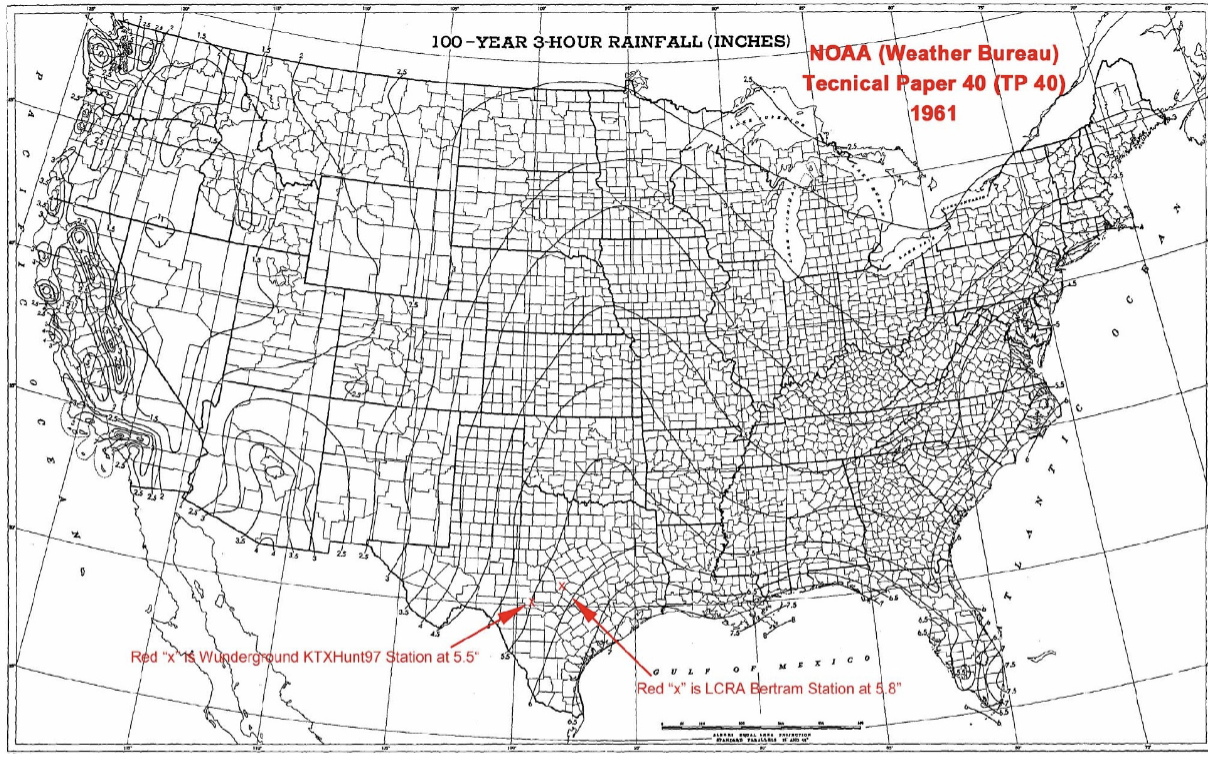
Atlas 14 (2018) for the Bertram gauge location 6.83 inches is the 100-year, 3-hour storm
Atlas 14 (2018) for the Bertram gauge location 11.2 inches is the 1000-year, 3-hour storm
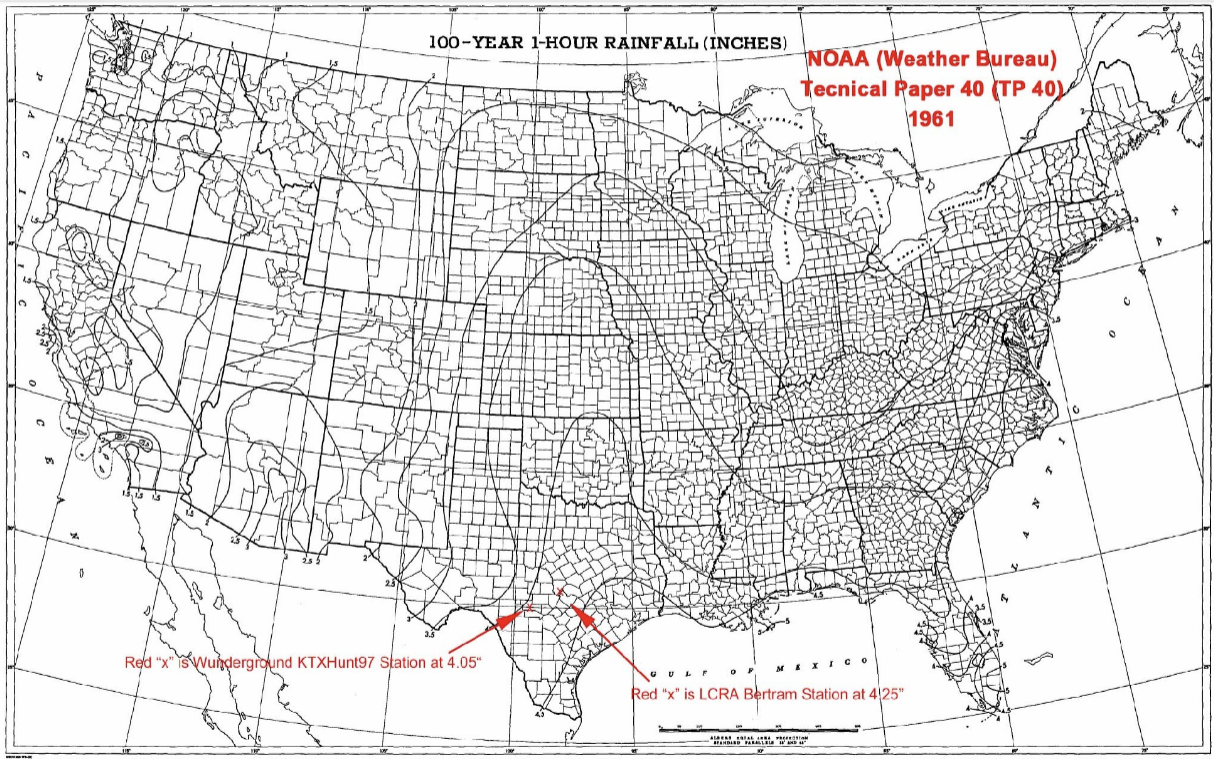
TP 40 (1961), Weather Bureau (NOAA) 5.8 inches is the 100-year, 3-hour storm
Atlas 14 hydrograph interpolation 3,500-year event
1-hour statistics
LCRA Hydromet, Bertram gauge, July 5, 2025 6 inches in 1 hour
Atlas 14 (2018) for the Bertram Gage Location 4.38 inches is the 100-year, 1-hour storm
TP 40 (1961), Weather Bureau (NOAA) 4.25 inches is the 100-year, 1-hour storm
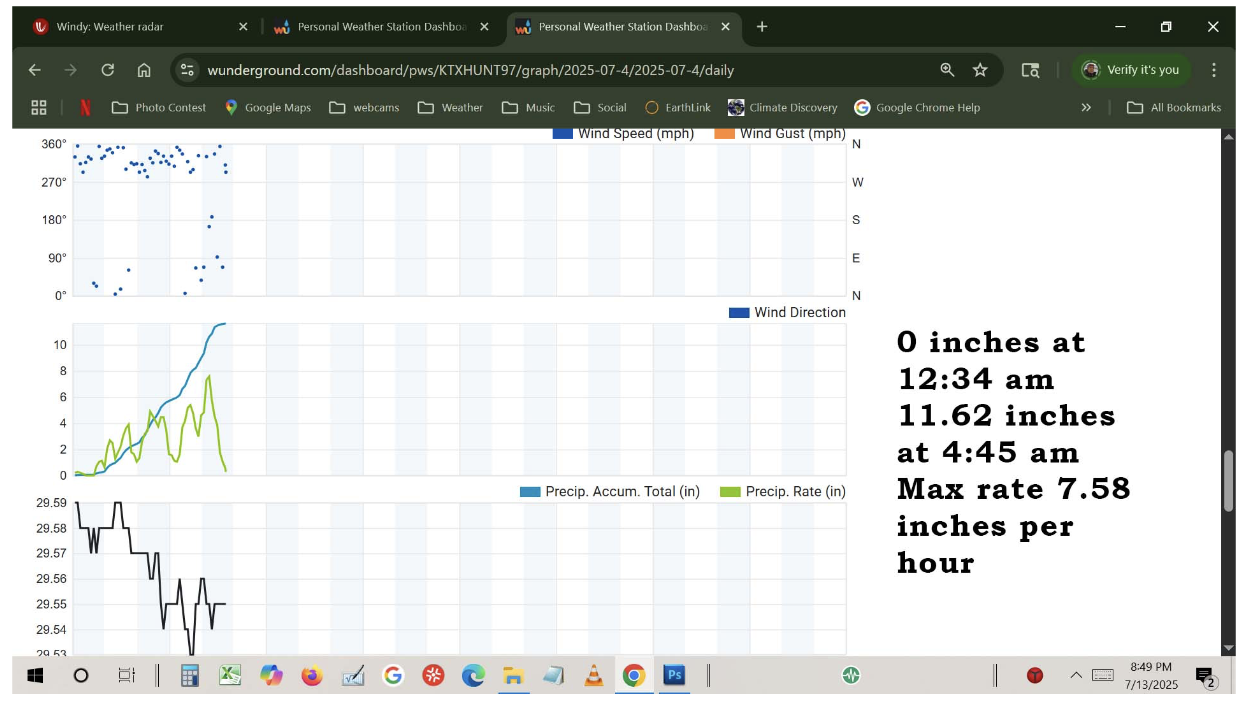
Kerrville, Wunderground Personal Weather Network station KTXHunt97
Wunderground, KTXHunt97 gauge, July 4, 2025 11.62 inches in 4:06 hours
Atlas 14 (2018) for the KTXHunt97 gauge 100-year, 4-hr = 7 inches
Atlas 14 (2018) for the KTXHunt97 gauge 1000-year, 4-hr = 10.5 inches
TP 40 (1961), Weather Bureau (NOAA) 5.83 inches is the 100-year, 3-hr storm
Atlas 14 hydrograph interpolation 2500-year event
What this all means… We have just begun to see the effects of climate warming on rainfall events and flooding because we have just recently warmed our climate beyond the natural variation of our old climate. Our flood infrastructure is significantly under designed for these new unprecedented conditions. NOAA’s flood design criteria (their Atlas rainfall intensity products) for new or rebuilt flood infrastructure is significantly understated. FEMA’s floodplains are based on NOAA’s understated design criteria. The effects of increasing rainfall intensity will increase nonlinearly in the future. And trump’s decimation of the National Weather Service, National Oceanic and Atmospheric Administration, and the Federal Emergency Management
Administration will make the effects of increasing flood extremeness even worse. In addition, Trump’s “delaying” of the completion of Atlas 15, and Atlas 15 Volume 2 that projects rainfall intensity into a warmer future, greatly compounds the worsening of future effects of climate warming.
It is time for a new mission in our climate culture; one of restoration, not further warming that creates even further unprecedentedly extreme events. We could rebuild all of humanity’s built environment to adapt, but at what cost? And, if we do not completely remove the warming gases and mechanisms that changed our hydrologic system, where does it stop? Natural feedback emissions have now begun. These emissions are created when our earth systems degrade and collapse, the process that has now begun since our climate has warmed beyond its natural variation.
We have just begun posting logs of our film documentation. Please visit our Instagram and or Facebook accounts to see more, lots more. And visit ClimateDiscovery’s post, It’s Flooding Down in Texas (https://climatediscovery.org/its-flooding-down-in-texas / ) to see the scientific references for this story, summarized in plain English, and to see the hydrologic reporting and derivation of the statistics presented above. We are the oldest independent climate science education organization in the world. We tell the story untold, based on science; a story that is vital to our future. Instagram – https://www.instagram.com/bruce.c.melton/
Facebook – https://www.facebook.com/bruce.melton.395
REFERENCES
Jonkman 2024 – Flooding globally per capita mortality rates were double 2022 rates in 1975… In spite of increasing population, mortality from extreme events has decreased over time because of “measures to reduce vulnerability, e.g. better warning and shelters.” During the study period, population has doubled from 4 to 8 billion, but mortality numbers have stayed the same. The reasons for the reduction are, “improved flood risk management practices over the last decades. This includes increased protection, better warning, forecasting and early warning communication and other forms of risk reduction.”
“The average number of fatalities per event (left) and the average number of people affected per event (right) in each year are shown in red in Fig. 3, showing a statistically significant downward trend (Mann–Kendall test p-values of 0.001 and 0.025, respectively). This reduction in the average impact (both fatalities and people affected) per event can be attributed to a) changes in reporting over time and b) improved flood risk management—as is further explained below.
A potential change in reporting is that more smaller events are getting reported for more recent decades, leading to an overall decline over time in the average number of fatalities (and affected people) per event. We have analyzed the annual number of reported events (see above) and the average number of killed and affected per event for various thresholds (more than 10, 100, 1000 fatalities). From the analysis, it appears that the average number of fatalities and affected per event decreases over time for all thresholds (Fig. 8 in the “Appendix”).
This shows that the downward trend is robust. It is therefore expected that improved flood risk management practices over the last decades will have contributed to the downward trend in fatalities per event. This includes improved forecasting and flood early warning, increased protection in several places, and other forms of risk reduction.” “A key question is which drivers have caused these trends. Increased reporting and effects of climate change would lead to increasing numbers of flood events. Climate change would lead to more frequent flood events and higher intensities (IPCC 2023). Population and exposure growth would mainly result in increasing event impacts. Measures to reduce vulnerability, e.g. better warning and shelters, will lead to a reduction in the mortality fraction. Protective measures, such as flood defenses, will prevent flood events or lower exposure by protecting parts of the population. Jonkmann et al., Floods have become less deadly – an analysis of global flood fatalities 1975–2022, Natural Hazards, February 27, 2024.
https://link.springer.com/article/10.1007/s11069-024-06444-
0?mc_cid=2e15364981&mc_eid=44e134bf32
REFERENCES FOR THE INCREASING NUMBER OF DISASTERS
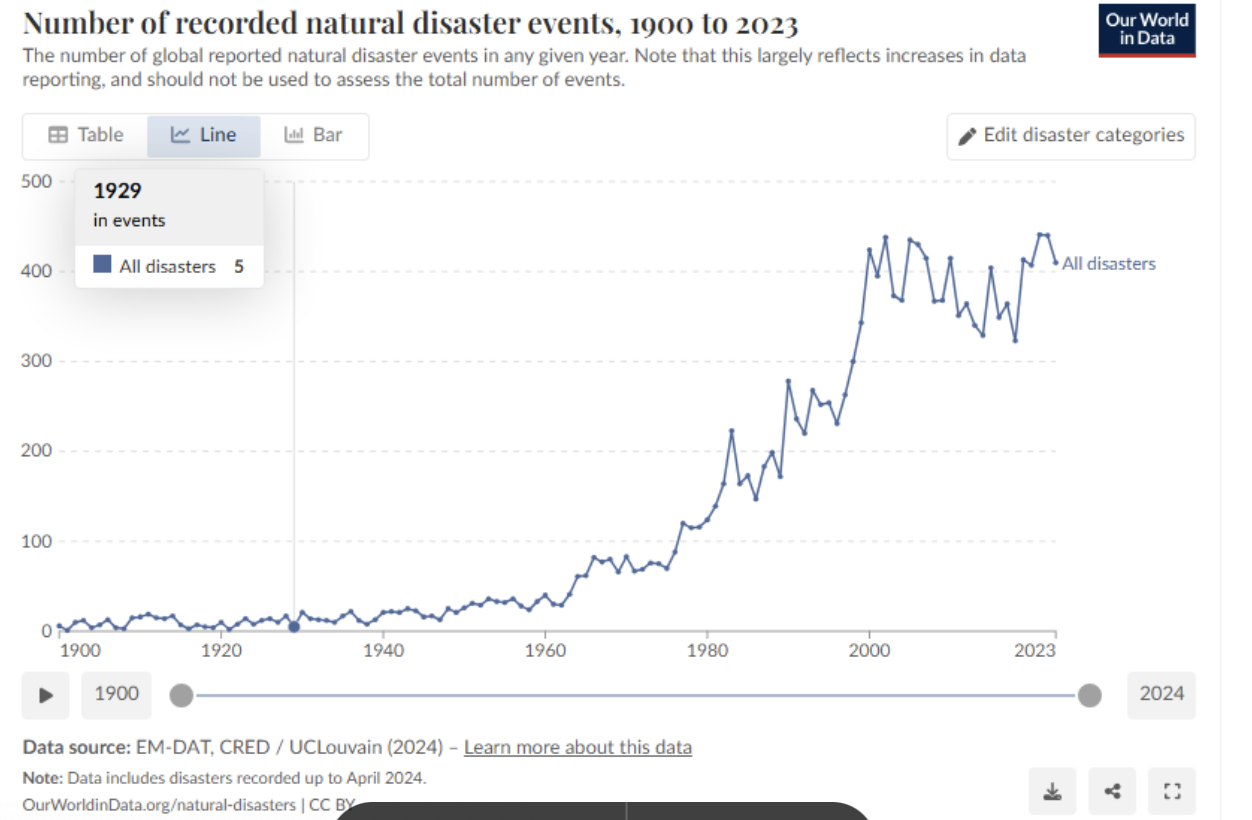
Ritchie and Rosado 2024 – Is the number of disasters increasing – Evaluation of the stark increase in disaster numbers since 1980… This “explainer” for Our World In Data, cautions that the number of reported disaster evident in the radically increasing number of disasters portrayed by International Disaster Database (EM-DAT), Centre for Research on the Epidemiology of Disasters (CRED), is biased by reporting that began rapidly increasing around 1980.
- Prior to this time, smaller disasters were not as important in reporting. Says Ritchie and Rosado. They continue, CRED developed the disaster database in the 1970s and 1980s, ramping up collection techniques and supposedly biasing the trend. Also noted, communication technologies developed rapidly over this period — most notably satellites, the Internet, and personal computers, allowing greater reporting of disasters.
Most importantly, say Ritchie and Rosado, extremeness of disasters is not reported in these numbers, where natural disaster extremeness with rainfall, floods, drought, fire and storms are definitively increasing in extremeness with warming.
- Image below is the EM-DAT CRED accounting of increasing weather disasters.
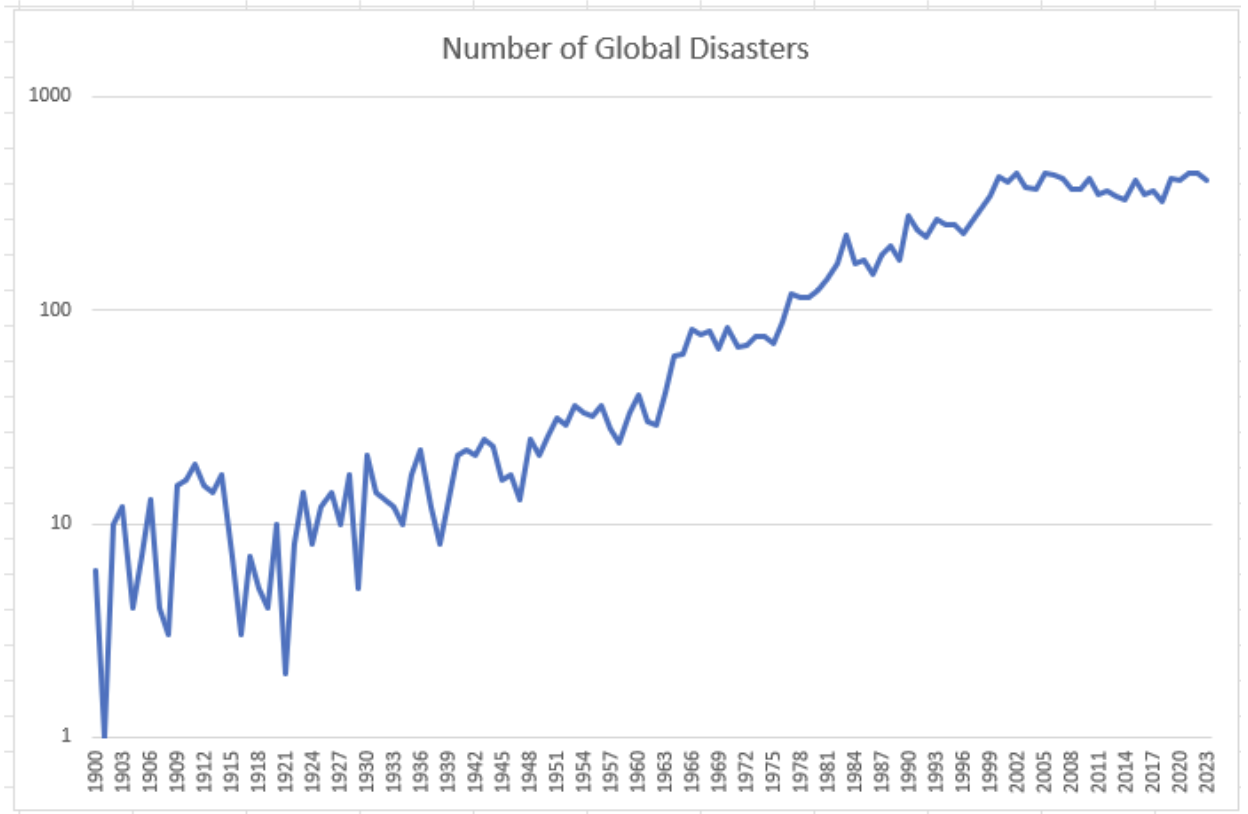
Care must also be taken when evaluating the increasing number of weather and climate related disasters so as to consider other biases. The absolute graphing above does not reflect the relative change in number of disasters shown in the log-scale graphing below. Here, there is no apparent break in the increase of reporting of disasters around 1980 – all the way back to the beginning of the data. Are Ritchie and Rosado wrong? Well, no, the concept of increased reporting of disasters beginning in +/- 1970 remains valid however, viewing the data as relative numbers versus gross accounting does not support a definitive break around the year 2000.
Now the question is, “Is the leveling of the number of disasters biased somehow?” The answer is, “absolutely.” Our industry of weather observation, reporting and forecasting made large leaps during World War II. This change of number of disasters is reflected in the log graphing before and after WWII. Then, beginning in the 1950s, 60s and 70s, early warning systems began to proliferate in developed nations, FEMA began documenting flood plains and began the Flood Insurance Rate Program in 1968. The NOAA Weather radio began to become prominent in the 1970s. Flood prevention infrastructure was virtually non-existent until the mid-1970s and is still
uncommon in many places in developed nations.
After 2000, flood resilience continued to increase in developed nations and developing nations began adopting flood resilience measures in a way similar to what developed nations did in the mid-20th century. The resilience efforts reduced the number of disasters occurring, and along with increases in resilience in the West, the number of disasters decreased further.
Considering the continued increasing state of resilience than, the leveling of the number of disasters since 2000 is likely biased as well because even though the number of disasters has not increased, without continued increasing resilience efforts their numbers would have surely increased because the increasing extremeness of weather events with warming has definitively shown to be valid.
Ritchie and Rosado, Is the number of natural disasters increasing? Explainer, Our World In Data,
June 3, 2024.
https://ourworldindata.org/disaster-database-limitations
Image Below is the EM-DAT CRED disaster count data (above) graphed in log format, that reveals relative trends instead of absolute numbers.
Care must also be taken when evaluating the increasing number of weather and climate-related disasters so as to consider other biases. The absolute graphing above does not reflect the relative change in number of disasters shown in the log-scale graphing below. Here, there is no apparent break in the increase of reporting of disasters around 1980 — all the way back to the beginning of the data. Are Ritchie and Rosado wrong. Well, no, the concept of increased reporting of disasters beginning in +/- 1970 remains valid however, viewing the data as relative numbers versus gross accounting does not support a definitive break around the year 2000.
Now the question is, “Is the leveling of the number of disasters biased somehow?” The answer is, “absolutely.” Our industry of weather observation, reporting, and forecasting made large leaps during World War II. This change of number of disasters is reflected in the log graphing before and after WWII. Then, beginning in the 1950s, 60s and 70s, early warning systems began to proliferate in developed nations, FEMA began documenting flood plains and began the Flood Insurance Rate Program in 1968. The NOAA Weather radio began to become prominent in the1970s. Flood prevention infrastructure was virtually non-existent until the mid-1970s and is still uncommon in many places in developed nations.
After 2000, flood resilience continued to increase in developed nations and developing nations began adopting flood resilience measures in a way similar to what developed nations did in the mid-20th century. The resilience efforts reduced the number of disasters occurring, and along with increases in resilience in the West, the number of disasters decreased further.
Considering the continued increasing state of resilience than, the leveling of the number of disasters since 2000 is likely biased as well because even though the number of disasters has not increased, without continued increasing resilience efforts their numbers would have surely increased because the increasing extremeness of weather events with warming has definitively shown to be valid.
Ritchie and Rosado, Is the number of natural disasters increasing? Explainer, Our World In Data,
June 3, 2024.
https://ourworldindata.org/disaster-database-limitations
Image Below is the EM-DAT CRED disaster count data (above) graphed in log format, that reveals relative trends instead of absolute numbers.
Angelakis 2023 – Engineers have reduced flood hazards for 2,000 years, beginning with the Roman Empire and Han Dynasty… Engineers have designed dikes, canals, river dredging, and urban storm drain systems to increased flooding resilience for two millennia.
“Trends in flood frequencies and flooding damage seem to be increasing, primarily due to a growing vulnerability caused by land-use changes in flood-prone areas and/or climate variability.” … “The average number of disasters such as floods, tornadoes and hurricanes caused by weather and the environment has increased by around 35% over the past three decades. Extreme weather and climate-related events alone accounted for 83 percent of all disasters over the past 10 years, resulting in 410,000 fatalities and 1.7 billion people affected
[4].”
Angelakis et al., Evolution of Floods – From Ancient Times to the Present Times, ca 7600 BC to the Present, and the Future, Land, June 11, 2023.
https://www.mdpi.com/2073-445X/12/6/1211
Red Cross-Red Crescent World Disaster Report 2020 – Natural disasters have increased in numbers 1990-2020 — We need to restore our climate… Three quarters of all disasters are weather or climate-related. Understand that future risks are going to be different from the past because of a changing climate. “The overall number and proportion of disasters that were triggered by climate- and weather-related hazards has increased most significantly. While in the 1960s, 76% of reported disasters were climate and weather related, this proportion rose to 83% during the past decade (2010–2019)” (a 10 percent increase.) The number of disasters increased 7 times from 1960 to 2020, with flooding and storm related disasters by far a significant majority, however the number of people affected has declined beginning in 2000, because of better infrastructure, planning and warnings.
One of the biggest changes will be the continued increases of compound and or cascading disasters. “We must address this threat by taking action to reverse climate change. In the meantime, we must work to limit the deaths and damage that climate-driven disasters are already driving.” … “even the most ambitious mitigation action will not stop the next period being marked by more frequent and intense extreme weather and climate events… prepare for and anticipate events ranging from local emergencies to mega-disasters, from the predictable to the unexpected.”
What do we do? “Long-term and medium/seasonal forecasts can be critical for planning and investment, and even short-term forecasts can be used to trigger rapid anticipatory action. We must ensure that our early warning systems reach and can be understood and used by the people they are meant to protect. We must also make sure that our investments in warning are matched by investments in early action or these warnings will not save lives.”
We need to increase aid to low-income countries that historically have been underfunded, where low-income people’s risks are greater than higher income peoples because of lack of education, infrastructure, planning, and recovery actions. These actions include transportation, health and wellbeing, focused on rural, as well as urban regions.
World Disaster Report – Come Heat or High Water, Tackling the humanitarian impacts of the climate crisis together, Red Cross and red crescent Societies, 2020.
https://www.ifrc.org/sites/default/files/2021-05/20201116_WorldDisasters_Full.pdf
Formetta and Feyen 2019 – Mortality and economic losses from global weather and climate-related disasters are 6.5 and 5 times greater per capita in 1980 versus 2016… (Abstract)
“decreasing trend in both human and economic vulnerability, with global average mortality and economic loss rates that have dropped by 6.5 and nearly 5 times, respectively, from 1980–1989 to 2007–2016. Flood and wind events counted for 32 and 28 percent We further show a clear negative relation between vulnerability and wealth, which is strongest at the lowest income levels.”
“The more a country is developed the higher are the investments in protection measures to natural hazards, early warning systems, and disaster risk management strategies. These actions facilitate not only the response but also the recovering phase that follow a natural disaster (e.g. Cavallo and Noy, 2010 ). This is confirmed by the clear negative relation between vulnerability and wealth for all the analyzed hazard except heatwaves.”Formetta and Feyen, Empirical evidence of declining global vulnerability to climate-related hazards, Global Environmental Change, May 25, 2019
https://www.sciencedirect.com/science/article/pii/S0959378019300378?via%3Dihub
Brooks and Doswell 2002 – Joplin tornado and historical mortality comparison, 12.5 times the 1925 per capita mortality rate in 2020… A little deeper interpretation, Brooks and Doswell cite several findings with rates from 12.5 times greater today than in 1925 to 13.5 times greater, and 17.5 times greater when comparing death rates to damages. The reasons for the decrease include: the beginnings of tornado forecasting, improved communications, spotter networks, and changes in construction.
(Abstract) “When the death toll is normalized by population, a near-constant rate of death is apparent until about 1925, when a sharp fall begins. The rate was about 1.8 people per million population in 1925 and was less than 0.12 people per million by 2000.”
“The decrease in death toll is even more apparent when the rate of death is normalized by the population of the United States, available from the U.S. Census Bureau2 (Fig. 3). Prior to 1925, the smoothed rate was relatively constant, showing a slight increase from about 1.6 to 1.8 per million. Since that time, however, the rate has decreased substantially, to a little over 0.11 per million, roughly 1/15th of the long-term average prior to 1925.
Many factors, including the beginnings of tornado forecasting, improved communications, spotter networks, and changes in construction, likely have been involved in this decrease [see Doswell et al. (1999) for more discussion]. There is no simple way to deconvolve the possible contributions from all those factors, so we do not assign a relative importance to any of them in particular. To put the change into perspective, however, a death rate of 1.8 per million people per year would have resulted in approximately 500 deaths in 2000, as compared with the actual number of 40.
Another way of looking at this change is to consider the impact on the death toll associated with the Oklahoma City tornado. A crude estimate of the death rate prior to the changes that occurred in 1925 can be obtained via multiplying the death toll by the change in the rate. Such an estimate applied to Oklahoma City gives a death toll of 540, implying that the efforts (intentional or unintentional) to improve tornado safety saved over 500 lives on 3 May 1999.
NOAA’s ATLAS 14 REFERENCES
Atlas 14 is significantly understated because of non-stationarity in data – NOAA’s Caveat… NOAA assumed the data for this evaluation was stationary, it is not and is in fact rapidly and recently increasing in intensity. Assuming stationarity is the only way to get traditional statistics used in classic weather analysis to work, (from Atlas 14 Section 4.5.5. , page 21, paragraph 5, “
Large caveats obviously must be associated with such an estimate, but it is of the same order as the estimate of 700 deaths based on the changes in the historical ratio of deaths to amount of damage in tornadoes (Doswell et al. 1999; Brooks and Doswell 2001).”
Brooks and Doswell, Deaths in the 3 May 1999 Oklahoma City Tornado form a Historical
Perspective, Weather and Forecasting, Vol 17, 2002.https://journals.ametsoc.org/view/journals/wefo/17/3/1520-
0434_2002_017_0354_ditmoc_2_0_co_2.xml
Trend analysis: The precipitation frequency analysis methods used in NOAA Atlas 14 are based on the assumption that the annual maximum series used in the analysis are stationary.”
Atlas 14 Point Precipitation Viewer
https://hdsc.nws.noaa.gov/hdsc/pfds/pfds_map_cont.html
Science basis – Atlas 14, Precipitation-Frequency Atlas of the United States Volume 11 Version
2.0, Texas, NOAA, 2018.
https://www.weather.gov/media/owp/oh/hdsc/docs/Atlas14_Volume11.pdf
Cheng and AghaKouchak 2014 – Non-stationarity underestimates extreme precipitation by as much as 60 percent… “Extreme climatic events are growing more severe and frequent, calling into question how prepared our infrastructure is to deal with these changes. Current infrastructure design is primarily based on precipitation Intensity-Duration-Frequency (IDF) curves with the so-called stationary assumption, meaning extremes will not vary significantly over time. However, climate change is expected to alter climatic extremes, a concept termed nonstationarity. Here we show that given nonstationarity, current IDF curves can substantially underestimate precipitation extremes and thus, they may not be suitable for infrastructure design in a changing climate. We show that a stationary climate assumption may lead to
underestimation of extreme precipitation by as much as 60%, which increases the flood risk and failure risk in infrastructure systems.
“Cheng and AghaKouchak, Nonstationary Precipitation Intensity-Duration-Frequency Curves for Infrastructure Design in a Changing Climate, Nature Scientific Reports, November 18, 2014.
https://www.nature.com/articles/srep07093
Leander Flood Study 2021 – Atlas 14 increases storm flows by 50%, Leander, Texas (Austin Region)… The Leander Flood Study shows Atlas 14 alone increases runoff flows through the study area by an average of 48 to 60 percent because of increasing rainfall intensity and frequency, and when impervious cover changes were included the increase was 50 to 100 percent. From page 2, paragraph 2, “In order to provide some initial context to the increases in flow associated with the model updates completed with this study, KFA performed a check run of the effective hydrologic model with no changes except for the use of Atlas 14 rainfall. Those results were compared to the results of the fully updated hydrologic model. That comparison
shows that the average flow increases by approximately 48% due to Atlas 14 rainfall, while the average flow increases by approximately 60% with all the model updates performed with this study.”
City of Leander Floodplain Model and Mapping Updates, Hydrologic and Hydraulic Technical Report, K.Frieze Associates, September 2021.
https://gis-leander.hub.arcgis.com/maps/0c0274efbc4a48acab7103db94f76152
Hurricane Harvey’s rainfall was increased 35 percent because of warming… Dynamic effects of warming increase rainfall intensities far beyond seven percent per degree C warming. Trenberth 2018 reviewed and evaluated the moisture conundrum with Harvey and suggested dynamic effects create at least a 2 to 4 times multiplier on rainfall capacity, where similar work has shown ranges 13 to 38%. He says that with 0.6 C warming and a 35% increase, this is “as much as 15 inches in places.” Imagine today, no, no imagination necessary, we have now warmed, just 20 years later, 1.0 degrees C more, and dynamic effects are nonlinear responses.
Trenberth et al., Hurricane Harvey Links to Ocean Heat Content and Climate Change
Adaptation, Earth’s Future, American Geophysical Union, May 9, 2018.
https://agupubs.onlinelibrary.wiley.com/doi/full/10.1029/2018EF000825
HYDROLOGY REFERENCES
Hydromet Screenshot – Bertram is the station with the bold blue rectangular box.

Nope. Haven’t seen this one – thanks. Lots of press but, nobody talks about 17 dead in the Big Sandy/Cow Creek/San Gabriel event. On any other day, this would have been the top story nationwide for three days. And I am going to critique this article below — it’s a lot like all the rest and the piece I am working on is designed to clarify these common things that popular press — and scientists, say about increasing extremes that are either inaccurate or worded very poorly, relative to the audience they are speaking to, be that the public or other scientists and etc.
A quick review – I greatly admire Jennifer Francis. She has done some phenomenal work. But like so many climate scientists, gets her words wrong. “clear signal and fingerprint of climate change in this type of event.” What does this mean to Joe and Karen Sixpack? Because of the long and sordid history of climate change awareness, this type of indistinct analogy must be avoided. Say “caused by” for goodness sakes. Catastrophes do not happen unless catastrophic thresholds are crossed. There is no longer any question that warming effects are “causing” these catastrophes. Not saying so distinctly gives readers the opportunity to interpret using their own knowledge that mostly is, “the influence of climate change on our lives is still disputed, exaggerated, or confused with naturally concurring events in our old climate, or not as bad as some say.”
And the author of this piece also makes another classic word choice error, “perfect storm”… These catastrophes are very likely common in our currently warmed climate. They are not caused by a statistically rare combination of multiple causes. And in reality, they are not even extreme relative to what could occur in our currently warmed climate — forget about further warming…
If we were to magically halt all warming this instant, because we have likely only experienced weather extremes from our currently warmed climate in the 5 or 10 years that our climate has been warmer than the natural variation of our old climate, statistically we have likely only encountered frequent extreme events of the 10-year, 5-year or more frequent occurance. As time passes — even with magically no more warming — rarer and much more extreme events will occur like the 25-, 50-, and 100-year events. This does not even take into consideration the 60 percent statistical understatement in Atlas 14 because of non-stationary data, that NOAA does
acknowledge, or that we have warmed a third more since Atlas 14 was published, than we warmed in the preceding 150 years. And Atlas 14 does not take into consideration that a little more warming from 2017, or from today, creates nonlinearly more extreme events, not a little more extreme.
At least they mentioned the “at or above all-time high record [atmospheric moisture] for July.” But they didn’t talk about dynamic effects near enough. They didn’t even mention the 7% increase in moisture capacity per degree C… Trenberth 2018 reviews and evaluated the moisture conundrum with Harvey and suggested dynamic effects create at least a 2 to 4 times multiplier on rainfall capacity, where similar work has shown ranges 13 to 38%. He says that with 0.6 C warming and a 35% increase, this is “as much as 15 inches in places.” Imagine today, no, no imagination necessary, we have now warmed, just 20 years later, 1.1 degrees C more, and dynamic effects are nonlinear responses.
And don’t get me started on attribution studies. These not only miss the catastrophism reality, but they give license to deny, because for every storm that was made 60 percent more likely by warming, 40 percent of the time their extremeness was not related to warming. &&& Did you see my frequency analysis of the Bertram gauge?! Six inches in one hour – 13.3 in 3: greater than a 2,000 year event…
They also missed the “headwaters effects and the storm direction effect. Headwaters generally have a palmate network of tribs that join at near a central location, like the N and S forks of the Guad. This amplifies flood waves significantly, relative to the main stem of a stream where tribs join at fairly regular intervals instead of all at once.
The directional effect is when a storm tracks the same direction as the flood wave. I think both were applicable in Kerrville, not sure about Cow Creek. Gulf of Mexico “marine heat wave”? Not any more. It’s now one continuous heat wave. Ocean temp has radically spiked with the spike in atmospheric temp.
I do tend to side with the understanding that NWS did their job appropriately. These nighttime MCV dumps are notoriously difficult. Maybe we could have had a better accumulation forecast and issued an emergency situation alert sooner if Trump had not canceled half the balloon flights in the area. But relative to history, I don’t see anything different with this event’s watches and warnings than I have seen for 30 or more years.
Alright – I have a radio interview on KOOP at 2 Friday the 1st, Rag Radio with Thorne Dreyer. We postponed our filming in Kerrville yesterday because of rain and a rise on the Guad. Going Friday. I am steadily entering posts on Cow Creek in my Insta account. &&& nothing from Forrest Wilder yet, I guess I have to do a PIR with the GBRA. I want those 15-minute data. Gotta see how many thousand-year storm Kerrville was.
Also – have you seen any radar movies of those cells over the Guad headwaters? I don’t know for sure they moved north following the flood wave, I am just reflecting climatology here.
Drying out,
B
Wang et al., Accelerated shifts from heatwaves to heavy rainfall in a changing climate. Climate and Atmospheric Science, July 10, 2025.
https://www.nature.com/articles/s41612-025-01113-w
(Paywall – requested) Martinez-Villalobos et al., Accelerating increase in the duration of heatwaves under global warming, Nature Geoscience, July 7 2025.
https://www.nature.com/articles/s41561-025-01737-
w?utm_source=Proactive+Pitching+Team&utm_campaign=a97a5f5c68-
EMAIL_CAMPAIGN_2025_07_08_02_17&utm_medium=email&utm_t
PR – Duration of heat waves accelerating faster than global warming – The longest and rarest heat waves — which can last for weeks — show the greatest increase in frequency.
https://newsroom.ucla.edu/releases/duration-of-heat-waves-accelerating-faster-than-global-warming
[Bruce Melton is a professional engineer, hydrologist, environmental researcher, filmmaker, climate science education specialist, author, and director of the Climate Change Now Initiative founded in 2005 — the oldest independent climate science education organization in the world. He is a regular contributor to The Rag Blog and Rag Radio.]
Nope. Haven’t seen this one – thanks. Lots of press but, nobody talks about 17 dead in the Big Sandy/Cow Creek/San Gabriel event. On any other day, this would have been the top story nationwide for three days. And I am going to critique this article below – it’s a lot like all the rest and the piece I am working on is designed to clarify these common things that popular press — and scientists, say about increasing extremes that are either inaccurate or worded very poorly, relative to the audience they are speaking to, be that the public or other scientists and etc.
A quick review – I greatly admire Jennifer Francis. She has done some phenomenal work. But like so many climate scientists, gets her words wrong. “clear signal and fingerprint of climate change in this type of event.” What does this mean to Joe and Karen Sixpack? Because of the long and sordid history of climate change awareness, this type of indistinct analogy must be avoided. Say “caused by” for goodness sakes. Catastrophes do not happen unless catastrophic thresholds are crossed. There is no longer any question that warming effects are “causing” these catastrophes. Not saying so distinctly gives readers the opportunity to interpret using their own knowledge that mostly is, “the influence of climate change on our lives is still disputed, exaggerated, or confused with naturally concurring events in our old climate, or not as bad as some say.”
And the author of this piece also makes another classic word choice error, “perfect storm”… These catastrophes are very likely common in our currently warmed climate. They are not used by a statistically rare combination of multiple causes. And in reality, they are not even extreme relative to what could occur in our currently warmed climate — forget about further warming…
If we were to magically halt all warming this instant, because we have likely only experienced weather extremes from our currently warmed climate in the 5 or 10 years that our climate has been warmer than the natural variation of our old climate, statistically we have likely only encountered frequent extreme events of the 10-year, 5-year or more frequent occurance. Astime passes — even with magically no more warming — rarer and much more extreme events will occur like the 25-, 50-, and 100-year events. This does not even take into consideration the 60 percent statistical understatement in Atlas 14 because of non-stationary data, that NOAA does
acknowledge, or that we have warmed a third more since Atlas 14 was published, than we warmed in the preceding 150 years. And Atlas 14 does not take into consideration that a little more warming from 2017, or from today, creates nonlinearly more extreme events, not a little more extreme.
At least they mentioned the “at or above all-time high record [atmospheric moisture] for July.” But they didn’t talk about dynamic effects near enough. They didn’t even mention the 7% increase in moisture capacity per degree C… Trenberth 2018 reviews and evaluated the moisture conundrum with Harvey and suggested dynamic effects create at least a 2 to 4 times multiplier on rainfall capacity, where similar work
has shown ranges 13 to 38%. He says that with 0.6 C warming and a 35% increase, this is “as much as 15 inches in places.” Imagine today, no, no imagination necessary, we have now warmed, just 20 years later, 1.1 degrees C more, and dynamic effects are nonlinear responses.
And don’t get me started on attribution studies. These not only miss the catastrophism reality, but they give license to deny, because for every storm that was made 60 percent more likely by warming, 40 percent of the time their extremeness was not related to warming. &&& Did you see my frequency analysis of the Bertram gauge?! Six inches in one hour – 13.3 in 3: greater than a 2,000 year event…
They also missed the “headwaters effects and the storm direction effect. Headwaters generally have a palmate network of tribs that join at near a central location, like the N and S forks of the Guad. This amplifies flood waves significantly, relative to the main stem of a stream where tribsjoin at fairly regular intervals instead of all at once. The directional effect is when a storm tracks the same direction as the flood wave. I think both were applicable in Kerrville, not sure about Cow Creek.
Gulf of Mexico “marine neat wave”? Not any more. It’s now one continuous heat wave. Ocean temp has radically spiked with the spike in atmospheric temp.
I do tend to side with the understanding that NWS did their job appropriately. These nighttime MCV dumps are notoriously difficult. Maybe we could have had a better accumulation forecast and issued an emergency situation alert sooner if trump had not canceled half the balloon lights in the area. But relative to history, I don’t see anything different with this event’s watches and warnings than I have seen for 30 or more years.
Alright – I have a radio interview on KOOP at 2 Friday the 1st, Rag Radio with Thorne Dreyer. We postponed our filming in Kerrville yesterday because of rain and a rise on the Guad. Going Friday. I am steadily entering posts on Cow Creek in my Insta account. &&& nothing from Forrest Wilder yet, I guess I have to do a PIR with the GBRA. I want those 15-minute data. Gotta see how many thousand-year storm Kerrville was. Also – have you seen any radar movies of those cells over the Guad headwaters? I don’t know for sure they moved north following the flood wave, I am just reflecting climatology here.
Drying out,
B
Wang et al., Accelerated shifts from heatwaves to heavy rainfall in a changing climate. Climate and Atmospheric Science, July 10, 2025.
https://www.nature.com/articles/s41612-025-01113-w
(Paywall – requested) Martinez-Villalobos et al., Accelerating increase in the duration ofheatwaves under global warming, Nature Geoscience, July 7 2025.
https://www.nature.com/articles/s41561-025-01737-
w?utm_source=Proactive+Pitching+Team&utm_campaign=a97a5f5c68-
EMAIL_CAMPAIGN_2025_07_08_02_17&utm_medium=email&utm_t
PR – Duration of heat waves accelerating faster than global warming – The longest and rarest
heat waves — which can last for weeks — show the greatest increase in frequency.
https://newsroom.ucla.edu/releases/duration-of-heat-waves-accelerating-faster-than-global-
warming
Repeatedly unprecedented weather events are not “acts of God,” in the context used to describe the Kerrville flood tragedy on July 4. They are not a “new normal,” because we are still warming rapidly and every little bit of warming creates a lot more extremeness because of the basics of physics and energy where a little more heat does not create a little more energy, it nonlinearly creates a lot more energy, that is then translated into nonlinearly more extreme weather. This process is ongoing, so there is nothing “normal” about weather today as it keeps on getting a lot more extreme with further warming.
Even if we were to magically halt all warming this instant and stabilize our climate at today’s temperature, the extremes would continue to automatically increase. This is because in this new “magically stabilized” climate we have only been warmer than the weather created in our old climate for five to ten years. Therefor it is likely that only the most frequent events today in our currently warmed climate, are the 2-, 5- and maybe the 10-year storm. As time passes, we
will automatically have to endure rarer and much more extreme events like the 25-, 50-, and
100-year storms.
We have warmed our climate beyond its natural variation. This means the temperature today is
warmer than the evolutionary boundaries of our Earth systems. These systems are our forests,
ocean currents, ice sheets, permafrost, etc. These evolutionary boundary rules are the same
for almost any system: once crossed, stress creates degradation that if not stopped by
removing the thing that caused the degradation to begin (warming effects,) the results are the
loss of many or all of the species and mechanisms in the system so they can be replaced by a
new system with new species and mechanisms that are tolerant of the new conditions.
Some systems, like our hydrologic system that is typically known as the hydrologic cycle, are a
little different and vastly more important. Our hydrologic system is the rain machine that
creates our food and gives us water – the basics of life. Our hydrologic system is also vitally
important in creating clouds. Different clouds cool by shading, or they warm like a blanket.
Changes in the types of clouds disrupt the balance of cloud cooling by reflecting sunlight
harmlessly aback into space, and warming by allowing sunlight to strike the ground, oceans of
plants that changes that sunlight into heat where it can be trapped by the greenhouse effect.
A warmer atmosphere holds more moisture – nonlinearly more according to the laws of heat.
Atmospheric moisture or water vapor, is the biggest greenhouse gas, responsible for two to
three times the warming of carbon dioxide depending on the response of clouds. Water vapor
however is not a greenhouse gas that we can control because it is directly related to
evaporation of water from oceans, soils, and vegetation based on the temperature. The
interplay of moisture in clouds is vital to our climate. A warmer climate creates fewer clouds
that allows more sunlight to be absorbed by Earth systems creating more warming that then
enters a feedback loop that allows even more moisture capacity in the atmosphere.
Each degree C (about 1.7 degrees F) warming allows the atmosphere to carry about seven
percent more moisture. This alone allows weather systems to create seven percent more
precipitation, but it doesn’t stop there. Dynamic effects (increase convection or rising water
vapor in clouds) further increase rainfall. Hurricane Harvey for example, produced 32 percent
more rainfall than an identical storm in the absence of global warming.
Warming amplifies the effects of the hydrologic system with significantly increased rainfall
intensity (inches per hour of rain) and more extreme and longer-lived drought. Our climate’s
temperature is warmer than any time in the last 10,000 years since the end of the last ice age,
or really, since before the beginning of the last ice age pulse 100,000 years ago. Rainfall
extremes therefore, are greater than any time our engineers have been designing stormwater
infrastructure: since Roman times; since the Chen Dynasty.
IMAGE 2 AND 3
Because of these changes to our hydrologic system, the National Oceanic and Atmospheric
Administration’s (NOAA) flood design criteria for new or rebuilt flood infrastructure are now
significantly understated. The Federal Emergency Management Administration’s (FEMA)
floodplains are based on rainfall intensity. The increased rainfall intensity increases flood
volume. NOAA has been working on successor documentation to their current Atlas 14
Precipitation Frequency Evaluations that provide engineers the criteria to safely design our
culture’s infrastructure to pass floods without harm to design our built infrastructure so that we
are safe from flooding. The trump administration, in addition to eviscerating the National
Weather Service, NOAA weather research, and FEMA, where FEMA is responsible for the lion’s
share of funding and resources to plan flood plains and recover after flood events, this brain
donor has now “delayed” the completion of work on NOAA’s new Atlas 15. Atlas 15 was
supposed to not only update parts of the country that have been a generation of more since
their last rainfall intensity evaluation, but to provide a Volume 2 of Atlas 15 that was forward
looking, providing engineers and flood planners with increased rainfall intensity design
guidance on a further warmed planet with further nonlinearly increasing rainfall intensity.
Repeatedly unprecedented extreme weather events, while they may technically be “acts of
God,” have been produced by humankind-caused warming of our climate, through the
emissions of climate pollution from burning fossil fuels and from land use changes and abuses.
The Texas floods, and other repeatedly unprecedented floods across the nation and the world,
have been creating tragedy after tragedy that are much more extreme than historic tragedies
from our old climate. These floods a have broken all-time records again and again. The Kerrville
tragedy flood was a 100-year flood according to FEMA’s dated floodplain mapping, last updated
in 2011, but the relatively isolated rainfall that created the tragedy was a 2,500-year storm. The
rainfall bullseye that created the Cow Creek flood in Travis, Williamson and Burnet Counties
was a 3,500-year storm. These extraordinary rainfalls, like the other thousand+ year events that
are way too common in the news, were created by human-caused warming and a warmer
atmosphere’s ability to hold and precipitate more moisture.
The Copernicus European Space Agency global temperature in 2024 was 1.5 degrees C above
normal from 1850 to 1900. Berkeley Earth was 1.62 degrees C warmer. In 2010 when data
acquisition was halted for the 2010 FEMA flood plain updates, our climate’s temperature was
about 1 degree C above normal. Since FEMA updated their flood plains, our climate has
warmed more than half as much as it warmed previous to 2011, all the way back to the 19 th
century.
These flood tragedies are not just the result of our flood protection infrastructure now being
undersized. They have been caused by complacency of our culture as our engineers have
created much greater safety for citizens than was afforded in the past. This new-found safety
has allowed us to minimize self-preservation behaviors, relative to our level of awareness of
threats in the past, before our engineers and planners created the technology and cultural
behaviors that have increased safety by such large margins today. Our engineering design
criteria we use to keep us safe were developed in a climate that is definitively not our climate
today. Warming matters to engineering. Today’s cultural/engineering and other safeguards that
protect us, our families and property, are now significantly compromised.
I filmed the Big Sandy Flood on July 9, just northwest of Austin, with 18 fatalities and 4 still
missing as of the writing of this article. The rainfall that created this flood on Big Sandy Creek,
Cow Creek, and the San Gabriel River between Leander and Burnet and Marble falls early in the
morning of July 5, 24 hours after the Kerrville tragedy, was about fifteen percent bigger than
the reports from Kerrville.
Any other time, the Big Sandy flood would be the top story for days across the country. But,
the Kerrville region’s event with 107 fatalities, may the Great Spirit watch over us all, has
allowed the Big Sandy flood to become a footnote. Between 1959 to 2019, there were 1,069
flood fatalities in Texas. The July 4-5 event toll is at 135, with 8 still missing.
Even with far better building codes, warnings, flood planning and a population that has more
than tripled since 1959, the Texas floods on July 4 and 5 stand alone. The only ones similar were
the 1913 and 1921 Texas floods caused by dying hurricanes and the Galveston flood of 1900
that killed 10,000 during a Category 4 hurricane in a time where there were no protective
building codes and meteorological forecasts for hurricanes were hardly in their infancy. While
the July 4 and 5 floods were seeded by a long dead tropical wave, the flooding magnitude was
because of increased moisture in the atmosphere, increased dynamic effects from warming,
and a stationary weather pattern, all caused by climate warming. Galveston island’s highest
elevation during the 1900 Hurricane was 8 feet above sea level and after the storm, a 17-foot
high, 3-mile-long seawall was built and 500 city blocks and every structure therein were raised
up to 17 feet higher than their pre-storm elevation. The 1913 and 1921 events each created
around 200 fatalities, also in a time when building codes, warning systems, flood plain
regulation, and emergency behaviors were nearly non-existent, and both were caused by dying
hurricanes.
Building codes today are far, far better than in the past. NOAA’s severe weather warnings were
started in 1952, but weather radio broadcasts did not become widespread across the US until
the mid-1970s. The federal Emergency Management Administration (FEMA) did not start
regulating floodplains until 1968. These things, along with flood aware planning and increased
emergency behavior awareness, have helped create a far safer world from flooding, until our
climate began changing. Today we are in the midst of a new world of weather extremes
because of climate warming. Because the last five to ten years of warming has now significantly
exceeded the natural variation of our old climate, we have just begun to seriously be impacted
by the real-world effects of warming, but this message is compromised by the media and
scientists that tell us this or that weather tragedy was made some percentage more likely
because of climate change. While these are valid statements, they can also be misleading.
There remains with these statements, some probability the events were not caused by climate
warming and therefor somehow, they don’t count. Add to this the tendency of media to report
on both sides of the climate warming story, where one side is false, and these things create
confusion among citizens that leads to less awareness of the risks of warming and delay of
action that could save their live or the lives of others.
IMAGE 4
Our modern world is now far safer than back in the day, at least it was before our climate
warmed beyond anything in at least 100,000 years. It is very important to understand just how
much safety our engineers have created for us.
Tornado deaths in the early 1900s were 12 to 17 times greater per capita than today. Per capita
mortality and economic losses from global weather and climate-related disasters were 6.5 and
5 times greater per capita in 1980 versus 2016. Flooding mortality in 1975 globally was double
what it is today. The number of disasters has increased by a factor of 7 since 1960, where these
are 83 percent climate and weather related, and fatalities have not been increasing, but
decreasing since 2000. This is because of further life-saving improvements in infrastructure,
planning and warnings.
Catastrophes do not happen unless thresholds are crossed. The thresholds that are creating
unprecedented tragedies today in our significantly warmed climate, have crossed critical
engineering, planning and awareness thresholds, where in almost all instances these thresholds
would not have been crossed in our old climate.
Our observations of the Sandy Creek flood were limited to Cow Creek, the drainage west of
Sandy a few miles. The LCRA Hydromet weather stations in the area shows the Big Sandy
Station lower down in the watershed where the fatalities occurred, was compromised and the
gauge at the Leander 5 W Station in the headwaters of Sandy showed only about 6″ in about 3
hours. On Cow Creek, the two downstream gauges show about 10 inches about in 3 hours. It’s
the headwater gauge on Cow Creek, (LCRA’s Bertram Station) that captures the significance of
this event with 13.3 inches in 3 hours, and 6 inches in 1 hour. The reports from Kerrville show a
bit less than 12 inches of rain in over four hours.
The actual storm cells that created the s tragedies were very limited in size, but these limits
don’t really matter to those who perished. Comparing their areail extent to the 1913 and 1921
hurricanes flood tragedies across Texas, their footprints are miniscule. Compared to Hurricane
Harvey, they are almost non-existent. The toll in human lives however, was far from
nonexistent.
We filmed Kerrville Monday the 21st of July. I have filmed more than 150,000 miles of climate
change-caused effects across North America; mountain ranges of forest decimated by native
insects; coastal forests obliterated by salt water poisoning from sea level rise and beaches
removed from the face of the earth by the same rise; our national treasures destroyed by both
insects and fire. Over 13,000 mature sequoias were killed by fire in California, almost all of
them in the historic fires of 2020 and 2021. This was over 17 percent of all of the 75,500 known
mature sequoias. In history, back a thousand years or more before Europeans, only several
hundred sequoias died. Most of these were killed by gravity – they simple fell over, Sequoias
are more permanent than geology.
The effects of warming on the built environment and humanity, these are hard. Effects to the
natural world are naturel. We caused them with climate change of course but nonetheless they
are natural. Things like these happen to our natural world every time our climate changes
abruptly. The last time was about 10,000 years ago. But, the impacts to humanity are
completely different. The sorrow is unimaginable. And then the joy, so out of place with all the
sorrow; the joy of a thousand volunteers coming together to help, from all over the United
States, Mexico and Canada, and from as far away as Israel and Czechoslovakia. Humankind is good. Love remains.
IMAGE 5
The 13.3 inches in 3 hours on Cow Creek is about a 3,500-year storm as per NOAA Atlas 14 for
Texas rainfall intensity guidance for engineers that includes some, but not near all climate
warming. Atlas 14 for Texas was adopted in 2018, the first change in rainfall intensity design
criteria in Texas since 1961. The new evaluation of rainfall data show that, in a broad band of
mostly coastal Texas extending 200 miles inland, the 100-year storm is now the 25-year storm.
That is, the storm that happened once every hundred years on average over very long time
periods in our old climate, now happens on average every 25 years, on average… Be warned
however, this revelation of the effects of warming on rainfall intensity is not even the most
meaningful reality of our rapidly warming climate as it relates to the hydrologic cycle system.
There are four understating issues with these new NOAA engineering criteria for flooding.
1) Nonstationary data… The common “frequentist” statistics NOAA used to evaluate rainfall
data is only valid if the data are stationary, or not moving. Because intensity is increasing with
warming, the data are moving. Cheng and AghaKouchak 2014 says that considering the data to
be stationary like NOAA admits they did in their process description of Atlas 14, causes an
understating error of up to 60 percent. To understand this “non-stationarity” issue, think of an
average of 100 years of data, where for 90 years the data were all about the same, and the last
ten years the data increased markedly with the largest increase in the last five years. When all
of this data is averaged together, the recent increase in rainfall intensity is averaged in with the
long- term rainfall intensities that were all about the same, significantly reducing the effects of
the increase. This is why Atlas 14 is understated, or intensities are actually up to 60 percent
greater than what Atlas 14 says. Because the Atlas 14 data for Texas are rapidly changing at the
very end of the rain gauge data, it is likely that Atlas 14’s work is understated near the
maximum of Cheng and AghaKouchak’s 60 percent.
2) Dated Data with Atlas 14… Data for Atlas 14 stopped in 2017. Since 2017 we have seen a
very significant rate of increase in warming where we have warmed a third as much as we
warmed in the previous 150+ years, with this further warming creating nonlinearly more rainfall
intensity.
3) Only recently warmed beyond the rainfall intensity of our cooler climate… We just warmed
above the maximum average natural variation of global temperature of about 1 degree C
warming since the mid- and late-1800s in the last 5 to 10 years, so it is likely that only high
frequency or relatively common events have occurred since, like the 10-, 5- and 2-year rainfall
events, and etc. As time passes it will become more likely that less frequent and significantly
more extreme events will occur, like the 25-, 50- and 100-year events. Important! This is if we
could magically halt all warming this instant. Less frequent (rarer) weather events only happen
(in general) with longer time frames, much longer than the 10 or fewer years since we warmed
above the natural variation of our old climate.
4) Atlas 14 is backwards looking… Because Atlas 14 is based on historic rainfall data, it does
include future increases in rainfall intensity after 2017, where warming creates nonlinearly
more rainfall intensity.
Case Study – The Leander Flood Study, 2021… The City of Leander contracted K Frieze
Associates to evaluate NOAA’s Atlas 14 in their region’s watersheds and found a +/- 50 percent
increase in flood volume because of increased rainfall intensity due to warming.
So, what is NOAA doing about this urgent understatement in their flood engineering design
criteria? John Nielsen-Gammon, the Texas State Climatologist, told me that NOAA is working on
high powered statistics to better represent Atlas 14’s engineering flood design criteria, and it
will likely be some time yet before these strategies are published. Importantly, even high-
powered statistics cannot robustly evaluate a moving target. Future work by NOAA will
certainly help, but the underlying nature of an unknown rate of increase of rainfall intensity
cannot be overlooked.
These things are of great cultural significance, but they are little known and poorly included in
our lives because of the momentum of the past and a mindset that too, comes from the past.
Before our climate warmed, our engineers and planners had very definitive norms from which
to make professional decisions about the safety of our built infrastructure and our behaviors in
extreme events. Disrupting the status quo with such an important mission as the safety of
humanity in a changed climate, so as to address something that has never happened to us as a
culture, where we have no historical behaviors from which to create future behaviors, is a
global challenge to say the least.
Below are some statistics on the floods in the Big Sandy and Kerrville areas. Please understand
that these statistics are a simple snapshot of data at very specific geographic locations. The
conditions that created these flood tragedies may vary from these statistics, but these are all
we have so far, to help us understand why these tragedies happened and the additional
extremeness beyond our historic climate that resulted.
IMAGE 6
A few notes on how land forms affect flood extremeness…
Headwaters flood enhancement… Headwaters are the very upper portions of watersheds
where streams first appear out of flat terrain. Headwaters in steep terrain are particularly
conducive to creating larger flood waves than flatter terrain. A flood wave is what hydrologist
call the rapidly increasing water level of a flood as it moves downstream in what are usually
identified as flash floods. In rare instances, a literal wall of water feet or more high can crash
down a streambed, but generally a flash flood rise takes tens of minutes, still leaving precious
little time to flee. The reason headwaters create larger flood waves is that most headwaters
consist of branching networks of tributaries that join together in close proximity to create a
named stream. This branching and the proximity of their convergences, along with the
increased runoff and high flow velocities associated with higher slopes, creates a flood wave
that is usually greater than a similar flood wave created by a similar storm further downstream
where tributaries’ junctions with the main stream are more spread out. It appears that Kerrville
and the Cow Creek events both originated in headwaters.
Another geographic consideration is the direction the stream flows and the direction the storm
moves. If the storm moves in the same direction as stream flow, runoff from tributaries can
enter the main stream as the flood wave passes downstream, increasing the flood wave height.
Whereas if the storm is moving in the opposite direction as stream flow, the flood wave
generally passes the mouths of tributaries along the main stream before the flood wave from
the tributary reaches the main stream. A radar movie of the Kerrville storm shows it was
moving in the same direction as stream flow. The Big Sandy storm appears to have been caused
just by extreme rainfall intensity, steep rocky soils, and the headwater effect.
Bertram Gauge Location, (Lower Colorado River Authority (LCRA) Hydromet (Big Sandy Area
Flood)
3-hour statistics
LCRA Hydromet, Bertram gauge, July 5, 2025 13.3 inches in 3:00 hours
Atlas 14 (2018) for the Bertram gauge location 6.83 inches is the 100-year, 3-hour storm
Atlas 14 (2018) for the Bertram gauge location 11.2 inches is the 1000-year, 3-hour storm
TP 40 (1961), Weather Bureau (NOAA) 5.8 inches is the 100-year, 3-hour storm
Atlas 14 hydrograph interpolation 3,500-year event
1-hour statistics
LCRA Hydromet, Bertram gauge, July 5, 2025 6 inches in 1 hour
Atlas 14 (2018) for the Bertram Gage Location 4.38 inches is the 100-year, 1-hour storm
TP 40 (1961), Weather Bureau (NOAA) 4.25 inches is the 100-year, 1-hour storm
Kerrville, Wunderground Personal Weather Network station KTXHunt97
Wunderground, KTXHunt97 gauge, July 4, 2025 11.62 inches in 4:06 hours
Atlas 14 (2018) for the KTXHunt97 gauge 100-year, 4-hr = 7 inches
Atlas 14 (2018) for the KTXHunt97 gauge 1000-year, 4-hr = 10.5 inches
TP 40 (1961), Weather Bureau (NOAA) 5.83 inches is the 100-year, 3-hr storm
Atlas 14 hydrograph interpolation 2500-year event
What this all means… We have just begun to see the effects of climate warming on rainfall
events and flooding because we have just recently warmed our climate beyond the natural
variation of our old climate. Our flood infrastructure is significantly under designed for these
new unprecedented conditions. NOAA’s flood design criteria (their Atlas rainfall intensity
products) for new or rebuilt flood infrastructure is significantly understated. FEMA’s floodplains
are based on NOAA’s understated design criteria. The effects of increasing rainfall intensity will
increase nonlinearly in the future. And trump’s decimation of the National Weather Service,
National Oceanic and Atmospheric Administration, and the Federal Emergency Management
Administration will make the effects of increasing flood extremeness even worse. In addition,
trump’s “delaying” of the completion of Atlas 15, and Atlas 15 Volume 2 that projects rainfall
intensity into a warmer future, greatly compounds the worsening of future effects of climate
warming.
It is time for a new mission in our climate culture; one of restoration, not further warming that
creates even further unprecedentedly extreme events. We could rebuild all of humanity’s built
environment to adapt, but at what cost? And, if we do not completely remove the warming
gases and mechanisms that changed our hydrologic system, where does it stop? Natural
feedback emissions have now begun. These emissions are created when our earth systems
degrade and collapse, the process that has now begun since our climate has warmed beyond its
natural variation.
We have just begun posting logs of our film documentation. Please visit our Instagram and or
Facebook accounts to see more, lots more. And visit ClimateDiscovery’s post, It’s Flooding
Down in Texas ( https://climatediscovery.org/its-flooding-down-in-texas / ) to see the scientific
references for this story, summarized in plain English, and to see the hydrologic reporting and
derivation of the statistics presented above. We are the oldest independent climate science
education organization in the world. We tell the story untold, based on science; a story that is
vital to our future.
Instagram – https://www.instagram.com/bruce.c.melton/
Facebook – https://www.facebook.com/bruce.melton.395
REFERENCES
Jonkman 2024 – Flooding globally per capita mortality rates were double 2022 rates in 1975…
In spite of increasing population, mortality from extreme events has decreased over time
because of “measures to reduce vulnerability, e.g. better warning and shelters.” During the
study period, population has doubled from 4 to 8 billion, but mortality numbers have stayed
the same. The reasons for the reduction are, “improved flood risk management practices over
the last decades. This includes increased protection, better warning, forecasting and early
warning communication and other forms of risk reduction.”
“The average number of fatalities per event (left) and the average number of people affected
per event (right) in each year are shown in red in Fig. 3, showing a statistically significant
downward trend (Mann–Kendall test p-values of 0.001 and 0.025, respectively). This reduction
in the average impact (both fatalities and people affected) per event can be attributed to a)
changes in reporting over time and b) improved flood risk management—as is further explained
below.
A potential change in reporting is that more smaller events are getting reported for more
recent decades, leading to an overall decline over time in the average number of fatalities (and
affected people) per event. We have analyzed the annual number of reported events (see
above) and the average number of killed and affected per event for various thresholds (more
than 10, 100, 1000 fatalities). From the analysis, it appears that the average number of fatalities
and affected per event decreases over time for all thresholds (Fig. 8 in the “Appendix”). This
shows that the downward trend is robust. It is therefore expected that improved flood risk
management practices over the last decades will have contributed to the downward trend in
fatalities per event. This includes improved forecasting and flood early warning, increased
protection in several places, and other forms of risk reduction.”
“A key question is which drivers have caused these trends. Increased reporting and effects of
climate change would lead to increasing numbers of flood events. Climate change would lead to
more frequent flood events and higher intensities (IPCC 2023). Population and exposure growth
would mainly result in increasing event impacts. Measures to reduce vulnerability, e.g. better
warning and shelters, will lead to a reduction in the mortality fraction. Protective measures,
such as flood defenses, will prevent flood events or lower exposure by protecting parts of the
population.
Jonkmann et al., Floods have become less deadly – an analysis of global flood fatalities
1975–2022, Natural Hazards, February 27, 2024.
https://link.springer.com/article/10.1007/s11069-024-06444-
0?mc_cid=2e15364981&mc_eid=44e134bf32
REFERENCES FOR THE INCREASING NUMBER OF DISASTERS
Ritchie and Rosado 2024 – Is the number of disasters increasing – Evaluation of the stark
increase in disaster numbers since 1980… This “explainer” for Our World In Data, cautions that
the number of reported disaster evident in the radically increasing number of disasters
portrayed by International Disaster Database (EM-DAT), Centre for Research on the
Epidemiology of Disasters (CRED), is biased by reporting that began rapidly increasing around
- Prior to this time, smaller disasters were not as important in reporting. Says Ritchie and
Rosado.
The continue, CRED developed the disaster database in the 1970s and 1980s, ramping up
collection techniques and supposedly biasing the trend. Also noted, communication
technologies developed rapidly over this period — most notably satellites, the Internet, and
personal computers, allowing greater reporting of disasters.
Most importantly say Ritchie and Rosado, extremeness of disasters is not reported in these
numbers, where natural disaster extremeness with rainfall, floods, drought, fire and storms are
definitively increasing in extremeness with warming.
Image below is the EM-DAT CRED accounting of increasing weather disasters.
IMAGE 7
Care must also be taken when evaluating the increasing number of weather and climate related
disasters so as to consider other biases. The absolute graphing above does not reflect the
relative change in number of disasters shown in the log-scale graphing below. Here, there is no
apparent break in the increase of reporting of disasters around 1980 – all the way back to the
beginning of the data. Are Ritchie and Rosado wrong. Well, no, the concept of increased
reporting of disasters beginning in +/- 1970 remains valid however, viewing the data as relative
numbers versus gross accounting does not support a definitive break around the year 2000.
Now the question is, “Is the leveling of the number of disasters biased somehow?” The answer
is, “absolutely.” Our industry of weather observation, reporting and forecasting made large
leaps during World War II. This change of number of disasters is reflected in the log graphing
before and after WWII. Then, beginning in the 1950s, 60s and 70s, early warning systems began
to proliferate in developed nations, FEMA began documenting flood plains and began the Flood
Insurance Rate Program in 1968. The NOAA Weather radio began to become prominent in the
1970s. Flood prevention infrastructure was virtually non-existent until the mid-1970s and is still
uncommon in many places in developed nations.
After 2000, flood resilience continued to increase in developed nations and developing nations
began adopting flood resilience measures in a way similar to what developed nations did in the
mid-20 th century. The resilience efforts reduced the number of disasters occurring, and along
with increases in resilience in the West, the number of disasters decreased further.
Considering the continued increasing state of resilience than, the leveling of the number of
disasters since 2000 is likely biased as well because even though the number of disasters has
not increased, without continued increasing resilience efforts their numbers would have surely
increased because the increasing extremeness of weather events with warming has definitively
shown to be valid.
Ritchie and Rosado, Is the number of natural disasters increasing? Explainer, Our World In Data,
June 3, 2024.
https://ourworldindata.org/disaster-database-limitations
Image Below is the EM-DAT CRED disaster count data (above) graphed in log format, that
reveals relative trends instead of absolute numbers.
IMAGE 8
Angelakis 2023 – Engineers have reduced flood hazards for 2,000 years, begin with the Roman
Empire and Han Dynasty… Engineers have designed dikes, canals, river dredging, and urban
storm drain systems to increased flooding resilience for two millennia.
“Trends in flood frequencies and flooding damage seem to be increasing, primarily due to a
growing vulnerability caused by land-use changes in flood-prone areas and/or climate
variability.” … “The average number of disasters such as floods, tornadoes and hurricanes
caused by weather and the environment has increased by around 35% over the past three
decades. Extreme weather and climate-related events alone accounted for 83 percent of all
disasters over the past ten years, resulting in 410,000 fatalities and 1.7 billion people affected
[4].”
Angelakis et al., Evolution of Floods – From Ancient Times to the Present Times, ca 7600 BC to
the Present, and the Future, Land, June 11, 2023.
https://www.mdpi.com/2073-445X/12/6/1211
Red Cross-Red Crescent World Disaster Report 2020 – Natural disasters have increase in
numbers 1990-2020 – We need to restore our climate… Three quarters of all disasters are
weather or climate related. Understand that future risks are going to be different from the past
because of a changing climate. “The overall number and proportion of disasters that were
triggered by climate- and weather-related hazards has increased most significantly. While in the
1960s, 76% of reported disasters were climate and weather related, this proportion rose to 83%
during the past decade (2010–2019)” (a 10 percent increase.) The number of disasters
increased 7 times from 1960 to 2020, with flooding and storm related disasters by far a
significant majority, however the number of people affected has declined beginning in 2000,
because of better infrastructure, planning and warnings. One of the biggest changes will be the
continued increases of compound and or cascading disasters. “We must address this threat by
taking action to reverse climate change. In the meantime, we must work to limit the deaths and
damage that climate-driven disasters are already driving.” … “even the most ambitious
mitigation action will not stop the next period being marked by more frequent and intense
extreme weather and climate events… prepare for and anticipate events ranging from local
emergencies to mega-disasters, from the predictable to the unexpected.”
What do we do? “Long-term and medium/seasonal forecasts can be critical for planning and
investment, and even short-term forecasts can be used to trigger rapid anticipatory action. We
must ensure that our early warning systems reach and can be understood and used by the
people they are meant to protect. We must also make sure that our investments in warning are
matched by investments in early action or these warnings will not save lives.” We need to
increase aid to low-income countries that historically ben underfunded, where low-income
people’s risks are greater than higher income peoples because of lack of education,
infrastructure, planning and recovery actions. These actions include transportation, health and
wellbeing, focused on rural, as well as urban regions.
World Disaster Report – Come Heat or High Water, Tackling the humanitarian impacts of the
climate crisis together, Red Cross and red crescent Societies, 2020.
https://www.ifrc.org/sites/default/files/2021-05/20201116_WorldDisasters_Full.pdf
Formetta and Feyen 2019 – Mortality and economic losses from global weather and climate-
related disasters are 6.5 and 5 times greater per capita in 1980 versus 2016… (Abstract)
“decreasing trend in both human and economic vulnerability, with global average mortality and
economic loss rates that have dropped by 6.5 and nearly 5 times, respectively, from 1980–1989
to 2007–2016. Flood and wind events counted for 32 and 28 percent We further show a clear
negative relation between vulnerability and wealth, which is strongest at the lowest income
levels.”
“The more a country is developed the higher are the investments in protection measures to
natural hazards, early warning systems, and disaster risk management strategies. These actions
facilitate not only the response but also the recovering phase that follow a natural disaster
(e.g. Cavallo and Noy, 2010 ). This is confirmed by the clear negative relation between
vulnerability and wealth for all the analyzed hazard except heatwaves.”
Formetta and Feyen, Empirical evidence of declining global vulnerability to climate-related
hazards, Global Environmental Change, May 25, 2019
https://www.sciencedirect.com/science/article/pii/S0959378019300378?via%3Dihub
Brooks and Doswell 2002 – Joplin tornado and historical mortality comparison, 12.5 times the
1925 per capita mortality rate in 2020… A little deeper interpretation, Brooks and Doswell cite
several findings with rates from 12.5 times greater today than in 1925 to 13.5 times greater,
and 17.5 times greater when comparing death rates to damages. The reasons for the decrease
include: the beginnings of tornado forecasting, improved communications, spotter networks,
and changes in construction.
(Abstract) “When the death toll is normalized by population, a near-constant rate of death is
apparent until about 1925, when a sharp fall begins. The rate was about 1.8 people per million
population in 1925 and was less than 0.12 people per million by 2000.”
“The decrease in death toll is even more apparent when the rate of death is normalized by
the population of the United States, available from the U.S. Census Bureau2 (Fig. 3). Prior to
1925, the smoothed rate was relatively constant, showing a slight increase from about 1.6 to
1.8 per million. Since that time, however, the rate has decreased substantially, to a little over
0.11 per million, roughly 1/15th of the long-term average prior to 1925. Many factors, including
the beginnings of tornado forecasting, improved communications, spotter networks, and
changes in construction, likely have been involved in this decrease [see Doswell et al. (1999) for
more discussion]. There is no simple way to deconvolve the possible contributions from all
those factors, so we do not assign a relative importance to any of them in particular. To put the
change into perspective, however, a death rate of 1.8 per million people per year would have
resulted in approximately 500 deaths in 2000, as compared with the actual number of 40.
Another way of looking at this change is to consider the impact on the death toll associated
with the Oklahoma City tornado. A crude estimate of the death rate prior to the changes that
occurred in 1925 can be obtained via multiplying the death toll by the change in the rate. Such
an estimate applied to Oklahoma City gives a death toll of 540, implying that the efforts
(intentional or unintentional) to improve tornado safety saved over 500 lives on 3 May 1999.
Large caveats obviously must be associated with such an estimate, but it is of the same order as
the estimate of 700 deaths based on the changes in the historical ratio of deaths to amount of
damage in tornadoes (Doswell et al. 1999; Brooks and Doswell 2001).”
Brooks and Doswell, Deaths in the 3 May 1999 Oklahoma City Tornado form a Historical
Perspective, Weather and Forecasting, Vol 17, 2002.
https://journals.ametsoc.org/view/journals/wefo/17/3/1520-
0434_2002_017_0354_ditmoc_2_0_co_2.xml
NOAA’s ATLAS 14 REFERENCES
Atlas 14 is significantly understated because of non-stationarity in data – NOAA’s Caveat…
NOAA assumed the data for this evaluation was stationary, it is not and is in fact rapidly and
recently increasing in intensity. Assuming stationarity is the only way to get traditional statistics
used in classic weather analysis to work, (from Atlas 14 Section 4.5.5. , page 21, paragraph 5, “
Trend analysis: The precipitation frequency analysis methods used in NOAA Atlas 14 are based
on the assumption that the annual maximum series used in the analysis are stationary.”
Atlas 14 Point Precipitation Viewer
https://hdsc.nws.noaa.gov/hdsc/pfds/pfds_map_cont.html
Science basis – Atlas 14, Precipitation-Frequency Atlas of the United States Volume 11 Version
2.0, Texas, NOAA, 2018.
https://www.weather.gov/media/owp/oh/hdsc/docs/Atlas14_Volume11.pdf
Cheng and AghaKouchak 2014 – Non-stationarity underestimates extreme precipitation by as
much as 60 percent… “Extreme climatic events are growing more severe and frequent, calling
into question how prepared our infrastructure is to deal with these changes. Current
infrastructure design is primarily based on precipitation Intensity-Duration-Frequency (IDF)
curves with the so-called stationary assumption, meaning extremes will not vary significantly
over time. However, climate change is expected to alter climatic extremes, a concept termed
nonstationarity. Here we show that given nonstationarity, current IDF curves can substantially
underestimate precipitation extremes and thus, they may not be suitable for infrastructure
design in a changing climate. We show that a stationary climate assumption may lead to
underestimation of extreme precipitation by as much as 60%, which increases the flood risk and
failure risk in infrastructure systems.
“Cheng and AghaKouchak, Nonstationary Precipitation Intensity-Duration-Frequency Curves for
Infrastructure Design in a Changing Climate, Nature Scientific Reports, November 18, 2014.
https://www.nature.com/articles/srep07093
Leander Flood Study 2021 – Atlas 14 increases storm flows by 50%, Leander, Texas (Austin
Region)… The Leander Flood Study shows Atlas 14 alone increases runoff flows through the
study area by an average of 48 to 60 percent because of increasing rainfall intensity and
frequency, and when impervious cover changes were included the increase was 50 to 100
percent. From page 2, paragraph 2, “In order to provide some initial context to the increases in
flow associated with the model updates completed with this study, KFA performed a check run
of the effective hydrologic model with no changes except for the use of Atlas 14 rainfall. Those
results were compared to the results of the fully updated hydrologic model. That comparison
shows that the average flow increases by approximately 48% due to Atlas 14 rainfall, while the
average flow increases by approximately 60% with all the model updates performed with this
study.”
City of Leander Floodplain Model and Mapping Updates, Hydrologic and Hydraulic Technical
Report, K.Frieze Associates, September 2021.
https://gis-leander.hub.arcgis.com/maps/0c0274efbc4a48acab7103db94f76152
Hurricane Harvey’s rainfall was increased 35 percent because of warming… Dynamic effects of
warming increase rainfall intensities far beyond seven percent per degree C warming.
Trenberth 2018 reviewed and evaluated the moisture conundrum with Harvey and suggested
dynamic effects create at least a 2 to 4 times multiplier on rainfall capacity, where similar work
has shown ranges 13 to 38%. He says that with 0.6 C warming and a 35% increase, this is “as
much as 15 inches in places.” Imagine today, no, no imagination necessary, we have now
warmed, just 20 years later, 1.0 degrees C more, and dynamic effects are nonlinear responses.
Trenberth et al., Hurricane Harvey Links to Ocean Heat Content and Climate Change
Adaptation, Earth’s Future, American Geophysical Union, May 9, 2018.
https://agupubs.onlinelibrary.wiley.com/doi/full/10.1029/2018EF000825
HYDROLOGY REFERENCES
Hydromet Screenshot – Bertram is the station with the bold blue rectangular box.
IMAGE 9 AND 10
IMAGE 11
IMAGE 19-26
Nope. Haven’t seen this one – thanks. Lots of press but, nobody talks about 17 dead in the Big
Sandy/Cow Creek/San Gabriel event. On any other day, this would have been the top story
nationwide for three days. And I am going to critique this article below – it’s a lot like all the rest
and the piece I am working on is designed to clarify these common things that popular press —
and scientists, say about increasing extremes that are either inaccurate or worded very poorly,
relative to the audience they are speaking to, be that the public or other scientists and etc.
A quick review – I greatly admire Jennifer Francis. She has done some phenomenal work. But
like so many climate scientists, gets her words wrong. “clear signal and fingerprint of climate
change in this type of event.” What does this mean to Joe and Karen Sixpack? Because of the
long and sordid history of climate change awareness, this type of indistinct analogy must be
avoided. Say “caused by” for goodness sakes. Catastrophes do not happen unless catastrophic
thresholds are crossed. There is no longer any question that warming effects are “causing”
these catastrophes. Not saying so distinctly gives readers the opportunity to interpret using
their own knowledge that mostly is, “the influence of climate change on our lives is still
disputed, exaggerated, or confused with naturally concurring events in our old climate, or not
as bad as some say.”
And the author of this piece also makes another classic word choice error, “perfect storm”…
These catastrophes are very likely common in our currently warmed climate. They are not
caused by a statistically rare combination of multiple causes. And in reality, they are not even
extreme relative to what could occur in our currently warmed climate – forget about further
warming…
If we were to magically halt all warming this instant, because we have likely only experienced
weather extremes from our currently warmed climate in the 5 or 10 years that our climate has
been warmer than the natural variation of our old climate, statistically we have likely only
encountered frequent extreme events of the 10-year, 5-year or more frequent occurance. As
time passes –even with magically no more warming– rarer and much more extreme events will
occur like the 25-, 50-, and 100-year events. This does not even take into consideration the 60
percent statistical understatement in Atlas 14 because of non-stationary data, that NOAA does
acknowledge, or that we have warmed a third more since Atlas 14 was published, than we
warmed in the preceding 150 years. And Atlas 14 does not take into consideration that a little
more warming from 2017, or from today, creates nonlinearly more extreme events, not a little
more extreme.
At least they mentioned the “at or above all-time high record [atmospheric moisture] for July.”
But they didn’t talk about dynamic effects near enough. They didn’t even mention the 7%
increase in moisture capacity per degree C…
Trenberth 2018 reviews and evaluated the moisture conundrum with Harvey and suggested
dynamic effects create at least a 2 to 4 times multiplier on rainfall capacity, where similar work
has shown ranges 13 to 38%. He says that with 0.6 C warming and a 35% increase, this is “as
much as 15 inches in places.” Imagine today, no, no imagination necessary, we have now
warmed, just 20 years later, 1.1 degrees C more, and dynamic effects are nonlinear responses.
And don’t get me started on attribution studies. These not only miss the catastrophism reality,
but they give license to deny, because for every storm that was made 60 percent more likely by
warming, 40 percent of the time their extremeness was not related to warming.
&&& Did you see my frequency analysis of the Bertram gauge?! Six inches in one hour – 13.3 in
3: greater than a 2,000 year event…
They also missed the “headwaters effects and the storm direction effect. Headwaters generally
have a palmate network of tribs that join at near a central location, like the N and S forks of the
Guad. This amplifies flood waves significantly, relative to the main stem of a stream where tribs
join at fairly regular intervals instead of all at once. The directional effect is when a storm tracks
the same direction as the flood wave. I think both were applicable in Kerrville, not sure about
Cow Creek.
Gulf of Mexico “marine neat wave”? Not any more. It’s now one continuous heat wave. Ocean
temp has radically spiked with the spike in atmospheric temp.
I do tend to side with the understanding that NWS did their job appropriately. These nighttime
MCV dumps are notoriously difficult. Maybe we could have had a better accumulation forecast
and issued an emergency situation alert sooner if trump had of not canceled half the balloon
flights in the area. But relative to history, I don’t see anything different with this event’s
watches and warnings than I have seen for 30 or more years.
Alright – I have a radio interview on KOOP at 2 Friday the 1st, Rag Radio with Thorne Dryer. We
postponed our filming in Kerrville yesterday because of rain and a rise on the Guad. Going
Friday. I am steadily entering posts on Cow Creek in my Insta account.
&&& nothing from Forrest Wilder yet, I guess I have to do a PIR with the GBRA. I want those 15-
minute data. Gotta see how many thousand-year storm Kerrville was.
Also – have you seen any radar movies of those cells over the Guad headwaters? I don’t know
for sure they moved north following the flood wave, I am just reflecting climatology here.
Drying out,
B
Wang et al., Accelerated shifts from heatwaves to heavy rainfall in a changing climate. Climate
and Atmospheric Science, July 10, 2025.
https://www.nature.com/articles/s41612-025-01113-w
(Paywall – requested) Martinez-Villalobos et al., Accelerating increase in the duration of
heatwaves under global warming, Nature Geoscience, July 7 2025.
https://www.nature.com/articles/s41561-025-01737-
w?utm_source=Proactive+Pitching+Team&utm_campaign=a97a5f5c68-
EMAIL_CAMPAIGN_2025_07_08_02_17&utm_medium=email&utm_t
PR – Duration of heat waves accelerating faster than global warming – The longest and rarest
heat waves — which can last for weeks — show the greatest increase in frequency.
https://newsroom.ucla.edu/releases/duration-of-heat-waves-accelerating-faster-than-global-
warming.