
The dead giants command a most unswerving attention.
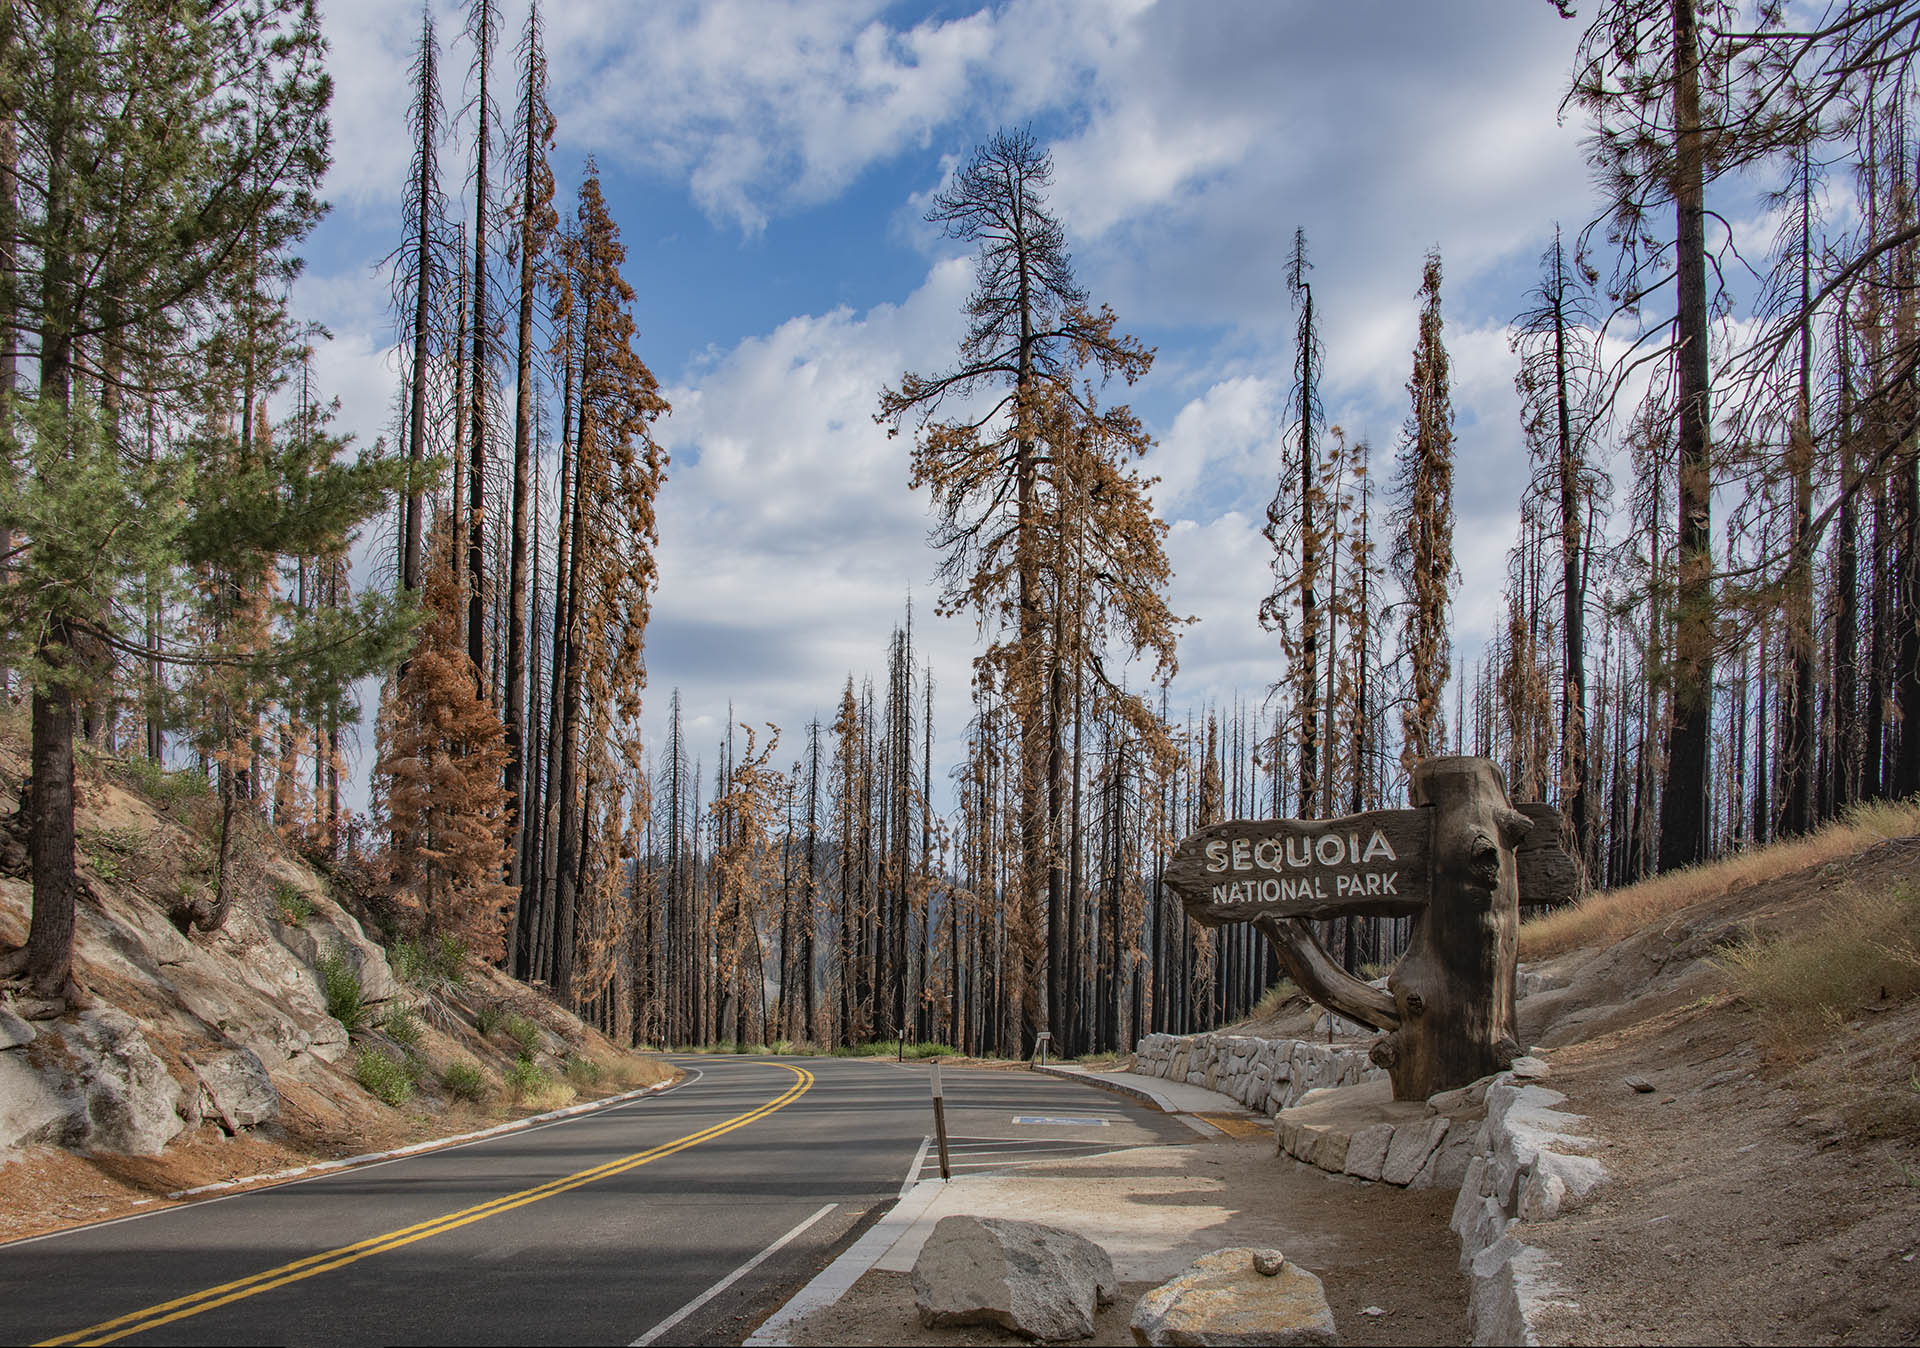
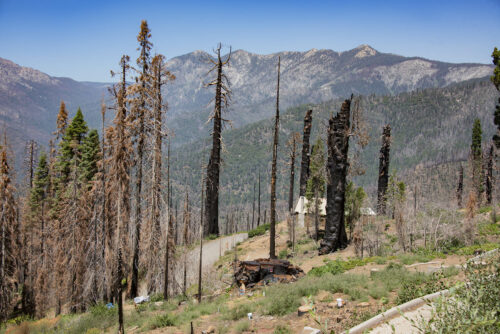
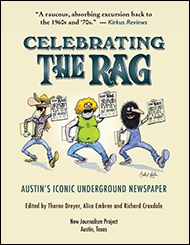
Entry Monument to Sequoia National Park after the KNP Complex Fire in 2021. All photos by Bruce Melton.
By Bruce Melton | The Rag Blog | September 22, 2022
Bruce Melton will be Thorne Dreyer’s guest on Rag Radio Friday, September 23, from 2-3 p.m. CT on KOOP 91.7-FM in Austin and streamed on KOOP.org.
The National Park Service says sequoias reached a tipping point when 13,000 of 75,000 known mature sequoias burned in 2020 and 2021.
This year’s filming of the sequoia burn started out with 1,500 miles from Austin to the big trees in the Sierra Nevada. While we were driving across New Mexico, flooding rains closed Death Valley National Park. Only one campground is open there and more roads than not have been heavily damaged. The Park Service hopes to reopen all roads in the park by Fall 2023. The largest two wildfires ever recorded in New Mexico happened this year, totaling over 650,000 acres. The three largest fires in Colorado history happened in 2020. The eight largest fires in the contemporary record in California have burned in the last six years. China broke all-time records this year with drought and heat. It was Europe’s hottest summer ever.
We camped at Quaking Aspen Campground in Giant Sequoia National Monument, just south of the National Park. The National Monument is home to half of the 70 known sequoia groves in the world. They are all on the western slope of the southern Sierra Nevada and they started to burn in 2015.
The latest count of mature sequoias burned is up to 13,316 since the Rough Fire in 2015; 12,918 of these were in 2020 and in 2021 six fires that burned over half a million acres. Five of the fires were caused by lightning. There were about 75,000 known mature sequoias. Also, mature means reproducing. A sequoia matures and is capable of reproduction when about four feet in diameter, or 300 to 500 years old.
Only a few hundred sequoias have died since record keeping began prior to 2015, and most of these did not burn, they simply fell over. The reasons sequoias have never before burned is their thick fireproof bark, their tall stature above the rest of the forest, and their sap has no flammable resin like other conifers.
Why are they burning? There is one historic factor with forest management and six new climate change factors that have caused sequoias to burn when sequoias have never burned before.
The historic factor that has increased fire is fire suppression.
The historic factor that has increased fire is fire suppression. Beginning in 1935, the U.S. Forest Service set a goal of all fires being out by 10 a.m. the morning following their discovery. In 1944, they introduced “Smokey Bear,” a young black bear cub rescued during WWII. Smokey was to become the new mascot of firefighting across the U.S.. The resulting fire suppression has increased the number of trees in the forest, increased understory growth that can act as a fire ladder to allow wildfire to reach tree crowns, and increased fallen fuel on the ground.
Since our climate has warmed out of the range of natural variability of our old climate in the last five to 10 years, wildfires have become much more extreme and much larger. Wildfire was increasing before our climate reached this tipping point with forest fires, but over the last five to ten years the increase has been much more than the gradual increase from excess fuels accumulation.
The reason why wildfire has moved through at tipping point is mostly dryness. Warmer temperatures increase evaporation from plants, soils, and water bodies nonlinearly, as in: a little warming doesn’t create a little more evaporation, it creates a lot more. This means that with normal and even above normal precipitation, drought can persist because evaporation increases nonlinearly with increasing warmth.
Specifically, the six fire behavior factors caused by climate change are: record dry fuels, a longer dry season with earlier spring and later fall, easier ignition with warmer temperatures, bigger wind storms, delayed onset of fall precipitation, and increased nighttime fire behavior. Smokey Bear fire suppression does add a bit to increased fire behavior, but these six climate change-enhanced fire behaviors are leading the list of the reasons we are seeing such an astonishing increase in fire. (1)
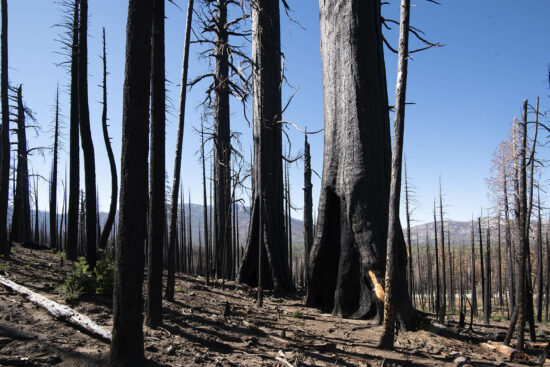
Freeman Creek Grove after the Castle Fire in 2020.
Our first day in the big trees we went to see the Freeman Creek Grove that burned in the Castle Fire. This fire was started by lightning in August 2020, burned 170,648 acres and killed 9,281 mature sequoias. The Freeman Creek Grove was the scene of the worst giant sequoia mortality by far. (2)
The Freeman Creek Grove is 19 miles north of Johnsondale on a barely paved and excellent road with zero traffic that follows above the Kern River.
We entered the black about half way to the grove. Much of this part of the Castle Fire was in scrub and was patchy, but tall trees weren’t far ahead. The farther we drove the more extreme the burn became. There is a really fine section of road that runs along the upper edge the canyon of the Kern River where the road had changed to all-weather dirt. Several miles later we came to the Freeman Creek Gove’s southern section where the burn was exceptionally severe.
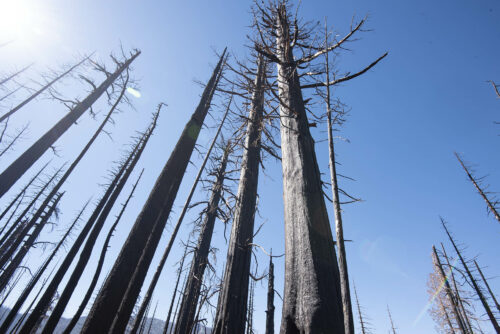
A severe burn is a sight to behold in normal circumstances, but when it is full of dead sequoias, the scene becomes surreal. Full grown non-sequoias shrink among the dominating shiny black sequoias. Without their bossy crowns, the sequoias appear as normal burned trees surrounded by black toothpicks that are actually the normal-sized trees.
In such an extreme burn there is just nothing that can supply scale.
In such an extreme burn there is just nothing that can supply scale. There was no groundcover or understory, just gray mineral soil and the ghostly impressions of fallen logs that burned to ash, leaving a lighter impression in the dark mineral soil covered with black carbon.
Nothing was alive. A faint raven croak could be heard occasionally. Though two springs had passed, hardly a sprig of green was visible. Shades of black and gray dominate the cloudless blue sky.
Giant sequoias after the Castle Fire 2020.
The dead giants command a most unswerving attention. They are literally the size of the Saturn V rocket that first took men to the moon. They are so large and so different in this sea of black. Some of their limbs had already crashed to the ground; great limbs six feet in diameter, smashed into bits because of their brittleness and the height of their fall.
When a giant falls it creates what foresters call a detonation zone where the giant smashes everything near it. The sequoia’s brittleness creates far more debris than a normal fallen tree, leaving a trench up to six feet in depth where the trunk lands.
Every burned giant remained standing where I observed, wandering what was once a grove of thousands of years old trees. Every step commanded my attention. Looking up so much, at so many towering black sentinels, meant not seeing the feet deep craters where root balls had burned out. Looking down to watch my feet meant not keeping an eye on those six foot diameter limbs that were sure to come down on my head if I stood in one place too long.
The sun was slanting low when I realized we had an hour and a half drive back to camp. I breathed a sigh of relief when I left the last of the shiny black monoliths behind. The entire afternoon, I had to keep reminding myself, “in fire there is rebirth, in fire there is rebirth.”
[See Sue Cag’s reporting on the Freeman Creek Grove burn at ILoveTrees.net.]
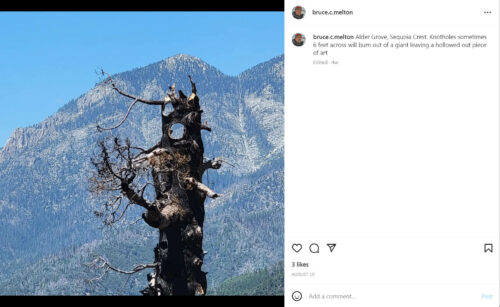
See our filming logs on Instagram
(Instagram Viewer for those without an Instagram account Instagram cover Sequoia Burn.)
Permafrost thaw has become so large in extent that it is emitting 2.3 gigatons (Gt) greenhouse gases per year on average from 2004 to 2017. Because permafrost was still storing carbon in 2004, a simple straight-line trend means permafrost in 2017 was emitting 4.6 Gt greenhouse gases. The trend is not linear, but exponential, and since 2017 substantial warming has occurred, meaning it is quite likely that emissions from permafrost are significantly in excess of 4.6 Gt annually. (7) The Amazon trend too, is also based on a long term average and emissions are likely double the one gigaton per year.
Canadian forests are emitting 250 million tons of greenhouse gases annually, largely because of beetle attack with fire emerging as a significant factor recently. (8)
All total, just these studied subcontinental scale systems collapses are emitting plausibly 7 Gt greenhouse gases per year. These collapses have just begun, and as go these systems, likely go similar systems across the planet.
The challenge we now face is time.
The challenge we now face is time. Natural systems respond to chronic stress, but with large natural climate variation making long time frames necessary to determine underlying trends.
Australian tropical forests have now been shown (2022) to be enduring a doubling of tree mortality. With a doubling of tree mortality, carbon storage is halved. Because forests are only modestly significant carbon sinks, the authors of this work from Oxford University say that it is likely Australian tropical forests have flipped from storing to emitting greenhouse gases too. (9) (These authors at Oxford are working on exactly how much carbon is being emitted, but have not published yet.) Australian tropical forests are likely an analog for all of Southeast Asian tropical forests as the authors state, “Many of the species in our plots are widespread across tropical Southeast Asia, offering a robust assessment of climate niche.” I wrote the principal author to get a confirmation on this analog and in response he upped the ante, “What makes the results of a marked increase in background mortality likely generalizable, to some extent, to other moist tropical regions, is the mechanism highlighted (atmospheric evaporative demand is increasing worldwide); the physiology of atmospheric water stress response is the same across tree species irrespective of their region of origin.”
This, “irrespective of their region of origin” is key and supports a broadened assumption that all areas of the globe are likely responding to warming and drying in a similar manner. The conditions where our Earth’s ecologies evolved have been compromised. Warming has created conditions beyond the evolutionary boundaries of our Earth systems. When evolutionary boundaries are exceeded, degradation, collapse, and even reversal of environmental services occur, as we are now seeing with forests and permafrost ecologies emitting more greenhouse gases than they are absorbing.
Forest mortality in the Sierra Nevada has doubled from 0.75 to 1.5 percent. Western Canada mortality has quadrupled. Eastern Canada has increased about 50 percent. Western U.S. interior forest mortality has doubled. Pacific Northwest mortality has tripled. (10) These mortality figures also do not include much of forest losses from beetle kill that has consumed much of 100 million acres across North America since 2000. (9) Also not included are recent fires. It takes much time to survey all the forest plots these data represent and generally their last census was 10 to 15 years ago. Since then, warming has almost doubled and as Williams 2018 states, “warming has grown increasingly impactful.”
A rebuilt home in Sequoia Crest.
Most of the named trees in the national park, national monument, and sequoia national forest were saved. I say “most” and mean “more than half.” There is no direct accounting of giants burned, yet. As we saw with the extraordinary conditions in the Freeman Creek Grove, very many giants did succumb.
There are strategies to adapt though. We have all seen the fireproof wrapping of giants with aluminized fire retardant blankets. At the Trail of 100 Giants in Sequoia National Monument, firefighters shot an arrow tied to a string through a sequoia crown and drug a water hose with sprinklers on it into the top of the tree. These strategies were very effective but realistically limited to only the most valuable trees. Some of the adaptation strategies however, appear to be questionable.
It makes sense to remove small trees close to giants. And small here is relative. A hundred foot-tall conifer six feet in diameter is small compared to a sequoia giant. Conditions are so dry with warming caused perpetual drought, that trees often torch or go up in a giant column of flame that rises a hundred feet or more above the top of the tree. If those trees were adjacent giants, the massive flame would ladder up and transfer from the top of the smaller tree torch to the lower needles on the giants that can be 300 feet tall with their lower branches 200 feet above the ground.
Extreme times require extreme responses.
Extreme times require extreme responses. Adaptive measures can provide safety for some giants. Other adaptive measures though, maybe not? Cutting beetle killed trees near giants is a common adaptive response, then the trunk and limbs are hauled away and burned out of reach of the giants. But these beetle killed trees don’t torch as they have no needles. When they burn, the flames are maybe feet long, not a hundred feet or more. Cutting and hauling them away deprives the forest floor around the giants of mulch; if left standing, bark and limbs fall over time replenishing forest mulch. Then the tree falls with further forest floor moisture conservation. This mulch is needed now more than ever to conserve scant precipitation from exponentially increased evaporation.
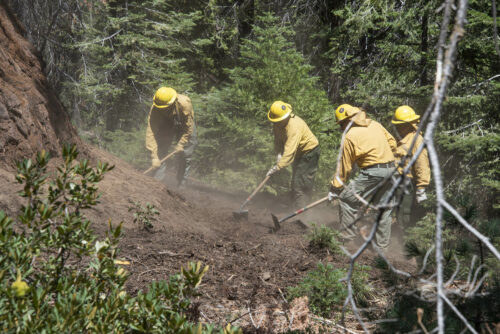
Forest workers “rake the duff” away from the base of a sequoia giant as a fire preventative adaption effort. Is this a good idea?
Another practice is raking the duff, which is tree needles and other organic material, away from the base of giants. Yes, raking the forest floor… Who would have thought that was actually a thing! But it is a thing. Obviously we can’t rake all forests, but what happens when we do?
The duff beneath a giant can be feet deep. It is full of small feeder roots from the sequoia but most important is its mulching ability. All of the duff is raked away from the giants about 20 foot out from the edge of the trunk, all the way down to mineral soil. This leaves zero mulch to preserve moisture in the most critical area of a sequoias root zone where the most roots occur.
The reason the duff is raked away is that most sequoias have ground level burn scars that over the centuries, get deeper and deeper with each successive fire that runs through the area. It takes hundreds and hundreds of years to threaten the structural stability of a sequoia through these repeated burnings, in our old climate. Today, with unprecedented risks from climate change-caused fires, one more fire could create a situation where the ground scar on a giant can burn the entire tree. Certainly though, removing all the mulch in the most critical part of the root zone is not the answer when the drying season has nearly doubled, temperatures are far beyond the evolutionary boundaries of the species, and precipitation, when it does come, comes hard and fast with lots of runoff.
Then there is prescribed burning, or cultural burning as the original peoples of our land practiced long before our colonialization decimated their numbers and took away the land that had sustained them for millennia.
Prescribed burning was once a necessary evil.
Prescribed burning was once a necessary evil, caused by that Smokey Bear fire suppression thing that allowed some of our forests to overgrow. A prescribed burn takes out the little stuff that can accumulate and allow laddering, but leaves the larger established trees. Almost all foresters believe prescribed burning can save our forests from climate change and many academics do too, but there is a rising number who interpret our current climate change-caused unprecedented situation differently.
Those six fire enhancing behaviors from climate change mentioned above are very significant compared to the excess fuels conundrum. Even though some of the six are not equal in fire behavior enhancing weight to excess fuels, some likely have greater ability to create extreme fires than does excess fuels alone. When combined, the six climate change-caused fire enhancing behaviors certainly are significantly more responsible for the increase of fire than Smokey Bear alone.
The bottom line is that prescribed fire burns away all the moisture conserving mulch that is more important today that in our old climate; likely, exponentially more important.
And too, there is a dark side to prescribed burns. The criteria for prescribed burning are now dated. Basically, the engineering to determine when it was safe to have a prescribed fire was done in our old climate. Because our climate has changed, those criteria no longer represent safety. More and more prescribed burns are getting out of control. Two prescribed burns in the Lost Pines east of Austin went out of control since we had Texas’ most unprecedented fire ever in 2011 where nearly 1,700 homes burned.
Our forest managers were doing what is normal after fire in our old climate, prescribed burning to manage scrub and thin regrowth. They were following all their rules for prescribed burning in our old climate. But the burns went out of control anyway.
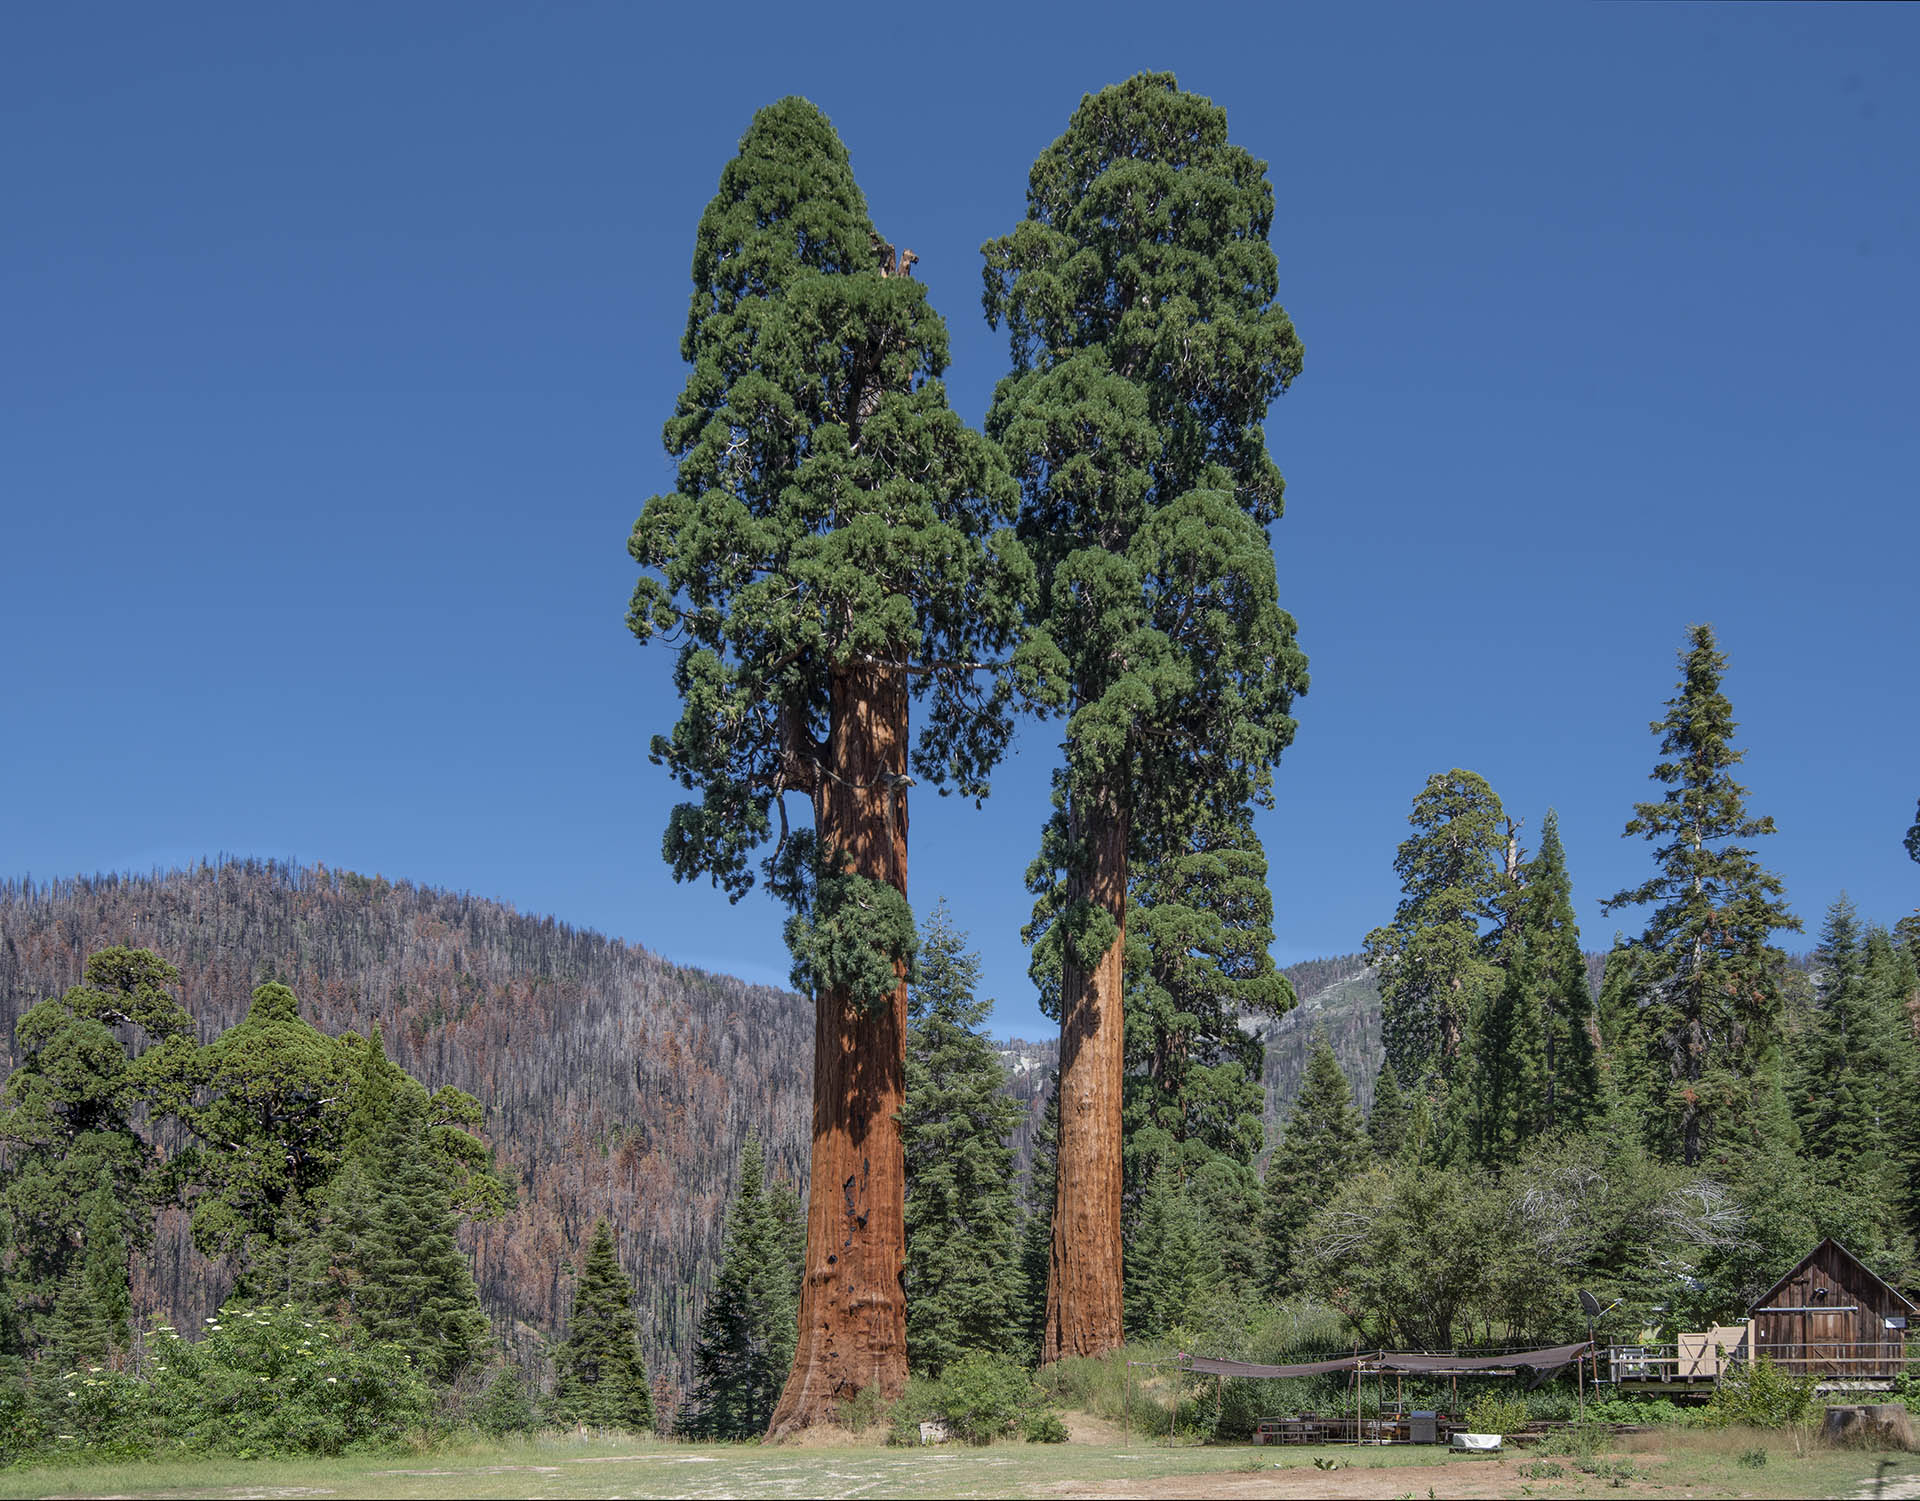
Surviving giants, Sequoia Crest community. Sue Cag is an independent conservationist who has created an outstanding documentation of sequoia loss from these climate change-caused fires. Her home was in Sequoia Crest where about half the giants, and half the homes burned, including Sue’s. See her work at ILoveTrees.net.
Image: Sequoia Crest two giants and awning 1920 px FRT_4687.jpg
Caption: Surviving giants, Sequoia Crest community. Sue Cag is an independent conservationist who has created an outstanding documentation of sequoia loss from these climate change-caused fires. Her home was in Sequoia Crest where about half the giants, and half the homes burned, including Sue’s. See her work at ILoveTrees.net.
The largest fire in New Mexico state history, that burned this year, the Hermit Peak Fire at 341,471 acres, was a prescribed burn that went out of control.
Simply put, criteria from our old climate is no longer valid, whatever the criteria may be. Humankind has never experienced climate change before. We do not know how to behave. Great caution should be used in all aspects of our lives that involve the natural world because we simply do not know how our world will behave in a different climate.
It may be possible to have safe prescribed burns in our new climate. But our new climate is getting dryer by the year, exponentially. As we warm even more though, to the commonly accepted target of 1.5 degrees C above normal from the late 19th century, fire behavior will do nothing but continue to grow, exponentially, like an avalanche. Considering the mayhem we see now began with about 1 C warming, and we are at about 1.2 C warming today, and impacts increase exponentially, further warming does not seem like a good idea.
So why is it then that our leaders and scientists say we can still warm to 1.5 C and be safe? It is because science is slow, scientists are reticent, and a consensus upon which our policy is based is significantly hampered by compromise. It takes time to gather data, interpret and publish, and abrupt climate change waits for none. Scientists understate to avoid being wrong because if they are wrong the academic journals will no longer publish them and their careers perish, endangering their families. A scientific consensus, upon which our climate policies are based, is a compromise as is any consensus. Put two experts in a room and ask them for a common statement on their specialty and invariable, a compromise will be posted. Our consensus organizations that review and summarize climate science from which our leaders create policy, is made up of hundreds of experts.
Half of known climate tipping systems are now active.
Abrupt climate change is now upon us. It’s called climate tipping. Half of known climate tipping systems are now active. These tipping systems were not supposed to activate until 5 degrees C warming, do not self-restore unless the perturbation that caused the collapse is removed, and half of climate tipping systems have feedbacks that create faster and more extreme tipping responses in other systems. (11)
This all just started when our Earth’s temperature warmed above the natural variation of its old climate, sometime between 2000 and 2015, between 0.5 and 1.0 C degrees above normal from the late 19th century depending on the system. Because the threshold has just been crossed, impacts more extreme than the rare and horrendous impacts in our old climate have just begun (like the 100-year event). And from here on, with continued warming to a target of 1.5 C as Williams 2018 says, impacts increase exponentially. (12)
These climate tipping systems are directly related to collapse of our Earth systems that include: tropical forests, ice sheets, high altitude and high latitude forests, permafrost, beaches, Gulf Stream, ocean acidity, sea ice, ice sheets, etc. Very importantly, this must be repeated again: once tipping collapses are activated they do not self-restore unless the perturbation that caused the collapse is removed.
Additional warming to 1.5 C allows these tipping collapses to become existential, releasing far more carbon into the atmosphere than us puny humans can emit. We do not know the time frames until the irreversible point of no return, but they are near. The forest cloud machine is an example. Forests, like any Earth systems have a buffering capacity to absorb degradation. Once this buffering capacity is used up, the system collapses and its environmental services reverse. This is already happening in the Amazon, Canadian Forests, permafrost, Australian tropical forests, and very likely the forests of western North America with mortality rates doubling to quadrupling. This is all very new to science that does not deal well with rapidly advancing situations with societal implications, and therefore it is yet poorly represented in policy.
Sierra Club, the oldest and most important environmental conservation organization on Earth, has responded appropriately however. They have adopted a warming target of less than 1 degree C above the late 19th century that is a true restoration target. The Club has taken this first of its kind leadership position so that our collapsing Earth systems can have their perturbations removed, which will allow them to self-restore.
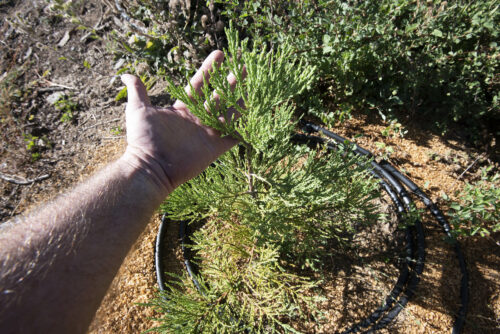
A sequoia seedling transplanted into the burn scar from the 2021 KNP Fire at Sequoia Crest. Because of the perpetual climate change-caused drought and the widespread and unprecedented extremeness of these sequoia killing fires, very few sequoias are sprouting naturally, so far.
So there is hope. Impacts we have been told were irreversible are not. The reason we have been told “irreversible” is called the scenario bias. Of the 1,202 scenarios evaluated and reported by the Intergovernmental Panel on Climate Change (IPCC), none are restoration scenarios. All include additional warming to at least 1.5 C (97 of them), or greater than 1.5 C (1,105 of them).
To restore our climate to less than a 1 degree C, to lower Earth’s temperature to within the evolutionary boundary conditions of our Earth systems so they can self-restore, we need to remove about the same amount of carbon from the atmosphere as the IPCC says we need to remove to achieve a 1.5 C warming target by 2100, only we need to do this by mid-century. The reason mid-century is that time is not on our side. A date of 2100 is far too distant and many already activated tipping collapses will likely become existentially irreversible by then.
We need to return Earth’s atmospheric temperature to normal.
The best data we have to avoid the point of no return is from some ice sheet modeling to allow the West Antarctic Ice sheet to self-restore by 2050. (13) To do this we need to return Earth’s atmospheric temperature to normal, and return at least the upper and upper-mid ocean temperature to normal. The reason the oceans must return to normal is ice sheet collapse is significantly driven by ocean warming and melt from below that destabilizes ice streams. This is where ice sheet collapse is coming from in Antarctica at least because air temperatures there are still far too cold to create significant surface melt. Greenland is seeing some surface melt, but it’s the oceans that rule.
To return Earth’s atmospheric temperature to normal we cannot rely upon emissions reduction alone, net zero, or a complete fossil fuel extinction because these all are only responsible for additional future warming. To cool earth, we must remove the accumulated carbon in the sky responsible for warming today because it is current warming that has caused these tipping collapses to begin.
Many advocates and scientists say atmospheric carbon removal is not feasible, while many say using existing, mature CO2 removal technologies is not only easy, but cheap. It is likely the later, but what if it is too expensive? Is anything too expensive to save humanity from the exponentially increasing impacts of runaway natural systems emissions due to climate tipping that is already active?
We spent $37 trillion a year in World War II adjusted for gross domestic product (GDP) for seven years in a row across the globe. We did this to save humanity from a scenario that was existential to some. That’s $261 trillion dollars for the seven years of the war, adjusted for global GDP from $6.37 trillion in WW II, to $87 trillion in 2019.
At the most widely accepted number of $100 a ton, to remove 1,000 gigatons that’s only $100 trillion and here is the thing: the $100 trillion is a scenario that uses the cheapest fracked gas at $0.03 kWh energy. If we were to use renewable energy running $0.01 kWh, where 87 percent of the air capture process costs is energy, the costs immediately dives to $39 per ton. And, this is with the tech as currently developed. Future generations of the process and scaling to the gigascale like we do across this gigaworld so often in the twenty-first century, reduces costs dramatically as with solar photovoltaics that were 35,000 percent more expensive in 1976 as they are today. (14)
Restoring our climate is a blatantly obvious move that is far more sustainable than simply halting emissions. It is time we addressed the obvious and added a new critical path to our climate change solutions. We must do everything we know how to do, net zero, recycle, reuse, EVs, renewables, all that, plus remove all the excess greenhouse gases in our sky so our collapsing Earth systems can self-restore.
Some systems obviously will not completely self-restore. Ice and sea level rise systems can only stabilize where they are at now in time frames that matter. But, but most can completely restore themselves.
Self-restoration of the burned sequoia forests will take many, many moons because of their great age, but in fire there is rebirth.
Sequoias Burn References
Melton 092222
1) Increasing fire behavior from climate warming…
California experienced a fivefold increase in annual burned area, mainly due to more than an eightfold increase in summer forest‐fire extent… Increased summer forest‐fire area very likely occurred due to increased atmospheric aridity caused by warming.
Williams et al., Observed Impacts of Anthropogenic Climate Change on Wildfire in California, American Geophysical Union, Earths Future, August 4, 2019.
https://agupubs.onlinelibrary.wiley.com/doi/pdf/10.1029/2019EF001210
An eightfold increase (800 percent) in high-severity fire (95% or greater mortality, Stevens 2017) burned area from 1985 to 2017, implicates increased probability of conversion of forests to alternative vegetation types…“Significant increases in annual area burned at high severity (AABhs) were observed across most ecoregions, with an overall eightfold increase in AABhs across western US forests. The relationships we identified between the annual fire severity metrics and climate, as well as the observed and projected trend toward warmer and drier fire seasons, suggest that climate change will contribute to increased fire severity in future decades where fuels remain abundant. The growing prevalence of high‐severity fire in western US forests has important implications to forest ecosystems, including an increased probability of fire‐catalyzed conversions from forest to alternative vegetation types.”
Parks and Abatzoglou, Warmer and Drier Fire Seasons Contribute to Increases in Area Burned at High Severituy in Western US Forests From 1985 to 2017, Geophysical Research Letters, October 22, 2020.
https://www.fs.fed.us/rm/pubs_journals/2020/rmrs_2020_parks_s002.pdf
Mortality of 95 percent or greater in high-severity fire…
Stevens et al., Changing spatial patterns of stand-replacing fire in California conifer forests, Forest and Ecology Management, June 23, 2017.
https://www.fs.fed.us/psw/publications/north/psw_2017_north005_stevens.pdf
An era when prefire forests may not return… “Changing disturbance regimes and climate can overcome forest ecosystem resilience. Following high-severity fire, forest recovery may be compromised by lack of tree seed sources, warmer and drier postfire climate, or short-interval reburning. A potential outcome of the loss of resilience is the conversion of the prefire forest to a different forest type or nonforest vegetation. Conversion implies major, extensive, and enduring changes in dominant species, life forms, or functions, with impacts on ecosystem services. In the present article, we synthesize a growing body of evidence of fire-driven conversion and our understanding of its causes across western North America. We assess our capacity to predict conversion and highlight important uncertainties. Increasing forest vulnerability to changing fire activity and climate compels shifts in management approaches, and we propose key themes for applied research coproduced by scientists and managers to support decision-making in an era when the prefire forest may not return.”
Coop et al., Wildfire Driven Forest Conversion in Western North American Landscapes, BioScience, July 1, 2020.
https://doi.org/10.1093/biosci/biaa061
Forest carbon sequestration policy does not always consider climate impact risks to forests stability where widespread climate change-induced forest die-offs are creating dangerous feedbacks…
“Forests have significant potential to help mitigate human-caused climate change and provide society with a broad range of co-benefits. Local, national, and international efforts have developed policies and economic incentives to protect and enhance forest carbon sinks – ranging from the Bonn Challenge to restore deforested areas to the development of forest carbon offset projects around the world. However, these policies do not always account for important ecological and climate-related risks and limits to forest stability (i.e. permanence). Widespread climate-induced forest die-off has been observed in forests globally and creates a dangerous carbon cycle feedback, both by releasing large amounts of carbon stored in forest ecosystems to the atmosphere and by reducing the size of the future forest carbon sink. Climate-driven risks may fundamentally compromise forest carbon stocks and sinks in the 21st century. Understanding and quantifying climate-driven risks to forest stability is a crucial component needed to forecast the integrity of forest carbon sinks and the extent to which they can contribute towards the Paris Agreement goal to limit warming well below 2 °C. Thus, rigorous scientific assessment of the risks and limitations to widespread deployment of forests as natural climate solutions is urgent.”
Anderegg et al., Climate-driven risks to the climate mitigation potential of forests, Science, June 19, 2020.
https://par.nsf.gov/servlets/purl/10182667
Climate Change Caused Wildfires: Columbia University, University of Idaho, Scripps Institution of Oceanography, University of Colorado Boulder… “During 1972–2018, California experienced a fivefold increase in annual burned area, mainly due to more than an eightfold increase in summer forest‐fire extent. Increased summer forest‐fire area very likely occurred due to increased atmospheric aridity caused by warming. Since the early 1970s, warm‐season days warmed by approximately 1.4 °C as part of a centennial warming trend, significantly increasing the atmospheric vapor pressure deficit (VPD). These trends are consistent with anthropogenic trends simulated by climate models. The response of summer forest‐fire area to VPD is exponential, meaning that warming has grown increasingly impactful. Robust interannual relationships between VPD and summer forest‐fire area strongly suggest that nearly all of the increase in summer forest‐fire area during 1972–2018 was driven by increased VPD. Climate change effects on summer wildfire were less evident in nonforested lands. In fall, wind events and delayed onset of winter precipitation are the dominant promoters of wildfire. While these variables did not change much over the past century, background warming and consequent fuel drying is increasingly enhancing the potential for large fall wildfires. Among the many processes important to California’s diverse fire regimes, warming‐driven fuel drying is the clearest link between anthropogenic climate change and increased California wildfire activity to date.”
Williams et al., Observed Impacts of Anthropogenic Climate Change on Wildfire in California, American Geophysical Union, Earths Future, August 4, 2019
https://agupubs.onlinelibrary.wiley.com/doi/epdf/10.1029/2019EF001210
Westerling – large California Wildfires are increasing nonlinearly with drying and earlier onset of spring… “Increases in large wildfires associated with earlier spring snowmelt scale exponentially with changes in moisture deficit, and moisture deficit changes can explain most of the spatial variability in forest wildfire regime response to the timing of spring.”
Westerling, Increasing western US forest wildfire activity, sensitivity to changes in the timing of spring, Philosophical Transactions of the Royal Society B, May 23, 2016, abstract.
http://rstb.royalsocietypublishing.org/content/371/1696/20150178
A paper in the Journal Fire, by a team from the Cooperative Institute for Mesoscale Meteorological Studies… Summary and Conclusions: “most acute fire weather in over two decades… longest duration Santa Ana wind event in the 70-year record… the most extreme drought on record… lowest fuel moisture on record… driest March through December since 1895.”
Nauslar et al., The 2017 North Bay and Southern California Fires, A Case Study, Fire, June 9, 2018.
https://www.mdpi.com/2571-6255/1/1/18/htm
Post-fire regeneration, regrowth, forest recovery – One third of burned forests are not regenerating at all… Conclusion, “Significantly less tree regeneration is occurring after wildfires in the start of 21st century compared to the end of the 20th century, and key drivers of this change were warmer and drier mean climatic conditions. Our findings demonstrate the increased vulnerability of both dry and moist forests to climate-induced regeneration failures following wildfires. The lack of regeneration indicates either substantially longer periods of forest recovery to pre-fire tree densities, or potential shifts to lower density forests or non-forest cover types after 21st-century wildfires… Our results suggest that predicted shifts from forest to non-forested vegetation may be underway, expedited by fire disturbances [and] that short post-fire periods of wetter climate that have favoured tree regeneration in the past may not occur frequently enough to facilitate tree regeneration in the future, across a broad region and multiple forest types in the Rocky Mountains… Our results suggest a high likelihood that future wildfires will facilitate shifts to lower density forest or non-forested states under a warming climate.”
Data, “For sites burned at the end of the 20th century vs. the first decade of the 21st century, the proportion of sites meeting or exceeding pre-fire tree densities (e.g. recruitment threshold of 100%) decreased by nearly half (from 70 to 46%) and the percentage of sites experiencing no post-fire tree regeneration nearly doubled (from 19 to 32%)… This negative relationship demonstrates the potential increased vulnerability and lack of resilience on hotter and drier sites, or of dry forest species, to climate warming… Tree seedlings may establish in response to short-term anomalous wetter periods in the future, but our results highlight that such conditions have become significantly less common since 2000, and they are expected to be less likely in the future… Further, persistent or long-lasting vegetation changes following wildfires have been observed worldwide.”
Stevens-Rumann et al., Evidence for declining forest resilience to wildfires under climate, Ecology Letters, December 12, 2017. (paywall)
Press Release, University of Montana –
https://www.eurekalert.org/pub_releases/2017-12/tuom-sfr121317.php
400 Degrees Hotter… Wildfires are burning 400 degrees F hotter because of drier fuels. “The infernos bellowed by those winds once reached a maximum temperature of 1,700 degrees Fahrenheit, Cal Fire’s Angie Lottes says; now they reach 2,100 degrees, hot enough to turn the silica in the soil into glass.”
Wallace-Wells, Los Angeles Fire Season Is Beginning Again. And It Will Never End. A bulletin from our climate future.
By David Wallace-Wells, NYMag, May 12, 2019.
http://nymag.com/intelligencer/2019/05/los-angeles-fire-season-will-never-end.html
2) Sequoia mortality from recent burns…
“This species has a limited distribution, covering just ~28,000 acres in ~70 groves on the western slopes of the Sierra Nevada mountains.”
“Wildfires sparked by lightning have killed about a fifth of the 75,000 large sequoias, The AP reported.” (75,580 Stephenson, Christy Brigham 2021)
NPS, 2021 Fire Season Impacts to Giant Sequoias – Executive Summary https://www.nps.gov/articles/000/2021-fire-season-impacts-to-giant-sequoias-executive-summary.htm
“On top of the 10-14% of large sequoias lost in the 2020 Castle fire, these fire impacts represent a significant threat to large sequoia persistence.”
Total Sequoia Mortality (Summary)
(Larger than 4 feet dia.)
Stephenson and Brigham 2021
Castle Fire 2020, 170,648 acres
9,281 killed
Rough Fire 2015, 151,547 acres
101 sequoias killed
Railroad Fire 2017, 12 407 acres
92 killed
Pier Fire 2017, 36,556 acres
205 killed
KNP Complex, 2021 lightning
88,307 acres
Up to 2,380 over 4 feet dia killed
Windy, 2021, lightning
97,528 acres
1,257 over 4 feet dia killed
TOTAL up to 13,521 mature sequoias over 4 feet diameter
Preliminary Estimates of Sequoia Mortality in the 2020 Castle Fire
Sequoia & Kings Canyon National Parks
Version: 25 June 2021 (DRAFT in press)
Authors: Nathan Stephenson, Christy Brigham
https://www.nps.gov/articles/000/preliminary-estimates-of-sequoia-mortality-in-the-2020-castle-fire.htm
Castle Fire 2020 – 9,281 were killed
“28,958 acres of groves in the Sierra
Nevada x 2.61 large sequoias / acre = estimated 75,580 large sequoias within the natural sequoia groves of the Sierra Nevada.”
“12.28 Est. % of all large sequoias in the Sierra Nevada were killed in the castle fire.”
“For all analyses presented here, we use the 16 April 2021 version of the grove maps. The initial remapping showed that total grove area in the Sierra Nevada = ~28,958 acres (a number that will likely change somewhat as the maps are refined and ground- truthed)”
“we defined large (mature) sequoias as those with trunk diameters of 4 feet or more”
“monarch” sequoias >10 ft diameter”
“For the Sierra Nevada as a whole, an estimated 32.91% of all grove area burned in the Castle Fire, and an estimated 9.70% of all grove area burned at high severity”
All of Sierra Nevada
“90% of sequoias in high-severity areas died, and we know that 9.70% of all grove area in the Sierra Nevada burned at high severity”
https://www.google.com/url?sa=t&source=web&rct=j&url=https://ucanr.edu/sites/forestry/files/347896.pdf&ved=2ahUKEwiazJazkPX4AhUJm2oFHYlIBCwQFnoECCQQAQ&usg=AOvVaw2vMqbSIC5DfFOCbXLp81_Z
Six Fires in Six Years
https://www.nps.gov/articles/000/wildfires-kill-unprecedented-numbers-of-large-sequoia-trees.htm
3) Calfire statistics… https://www.fire.ca.gov/media/4jandlhh/top20_acres.pdf
4) CalFire alone spent $3.1 billion in fire suppression costs in 2020… As of October 19, 2020, the California Legislative Analyst’s Office projected the 2020 fire season’s fire suppression costs to be $3.1 billion. This does not count local, Bureau of land management or National Forest Service expenditures.
State Wildfire Response Costs Estimated to Be Higher Than Budgeted, California Legislative Analyst’s Office, October 19, 2020.
https://lao.ca.gov/Publications/Report/4285
5) The 2018 Camp Fire in Paradise burned 14,000 homes in just 6 hours… The Camp Fire in Paradise, California became the most destructive and deadly fire in California history, with over 18,000 destroyed structures, 700 damaged structures, and 85 fatalities.
Maranghides, A study of the Camp Fire – Fire Progression Timeline, NIST Technical Note 2135, February 8, 2021.
Summary and link to paper – https://www.nist.gov/publications/case-study-camp-fire-fire-progression-timeline
Paper – https://nvlpubs.nist.gov/nistpubs/TechnicalNotes/NIST.TN.2135.pdf
6) Amazon emitting, not absorbing, 1 Gt CO2 annually on average from 2010 to 2018… “The study found fires produced about 1.5bn tonnes of CO2 a year, with forest growth removing 0.5bn tonnes. The 1bn tonnes left in the atmosphere is equivalent to the annual emissions of Japan.”
Carrington, Amazon rainforest now emitting more CO2 than it absorbs, Guardian, July 14, 2021.
https://www.theguardian.com/environment/2021/jul/14/amazon-rainforest-now-emitting-more-co2-than-it-absorbs
Gatti et al., Amazonia as a carbon source linked to deforestation and climate change, Nature, July 14, 2021.
https://www.nature.com/articles/s41586-021-03629-6.epdf?sharing_token=lsfPlVRsW05dUMB_VD-zItRgN0jAjWel9jnR3ZoTv0NILaci0q8CXtVe4JKM-xF0Z0ZQpmJpnpSclAjJeIV-vCjviXK_Mb9hvvU5C3CiJVgu82-RGuHR01gFiQZAVMzDCCxiRyvlh0MBQxTvGN2oHmf2jIOC7MEEGXrOPGIblsh57v9qXkkZbM7U0OH8zbdQ4jnVO1zD9R1jeDcUVBS22YVLkjWEvC5vrNMdQ416fmEBL9kIHYs2ptVibFKXLxEuh-TQ08w-QGSFzN6221KgguYTe0Q9FoZ1J-Wksf4tWXrjv-xu34UpgYqxQWwLTTbTgHYTuglT_tSVd4WaweL9fg%3D%3D&tracking_referrer=www.theguardian.com
Guardian article above based on Gatti 2021… “Considering the upwind areas of each site, we combine fluxes from all sites to calculate a total Amazonia carbon balance for our nine-year study period (see Methods) of 0.29±0.40 Pg Cyr−1 (FCTotal=0.11±0.15gCm−2d−1), where fire emissions represent 0.41±0.05PgCyr−1 (FCFire=0.15±0.02gCm−2d−1), with NBE removing −0.12±0.40PgCyr−1 (31% of fire emissions) from the atmosphere (FCNBE=−0.05±0.15gCm−d−1). The east (region 1 in Extended Data Fig.6), which represents 24% of Amazonia (of which 27% has been deforested), is responsible for 72% of total Amazonian carbon emissions, where 62% is from fires. One recent study showed cumulative gross emissions of carbon of about 126.1MgCO2 ha−1 for 30yr after a fire event, where cumulative CO2 uptake from forest regrowth offsets only 35% of the emissions. Another recent study13 reported that fire emissions from Amazonia are about 0.21±0.23PgCyr−1. Recently, vander Werf etal.24 estimated for the period 1997–2009 that globally, fires were responsible for an annual mean carbon emission of 2.0PgCyr−1, where about 8% appears to have been associated with South American forest fires, according to estimates from the Global Fire Emission Data set (GFED V.3). The Amazon Forest Inventory Network (RAINFOR) project showed a decline in sink capacity of mature forests due to an increase in mortality1–3. Adjusting the three RAINFOR studies to a consistent area (7.25×10⁶km2) and taking their mean yields a basin-wide sink for intact forests of about −0.57, −0.41 and −0.23PgCyr−1 for 1990–1999, 2000–2009 and 2010–2019, respectively. The NBE from this study is consistent with the RAINFOR results for the last decade, because NBE represents the uptake from forest but also all non-fire emissions, such as decomposition, degradation and other anthropogenic emissions (see Supplementary Table 3).”
7) Permafrost emissions of 2.3 Gt CO2eq average annually 2003-2017… Because this science is so new it has not yet penetrated consensus reporting organizations like IPCC. Total human methane emissions are 0.36 Gt annually, or 16 percent of permafrost collapse emissions. Importantly, the permafrost collapse emissions are average from 2003 – 2017. Because this 2.3 Gt number is an average, and because permafrost was at least stable and not emitting in 2003, the linear increase is double the 2.3 Gt average in 2017 (or 4.6 Gt annually), and the collapse is anything but linear meaning the actual emissions from permafrost now is likely in excess of 4.6 Gt, which is 10 x the total human-caused methane emissions.
Natali et al., Large loss of CO2 in winter observed across the northern permafrost region, Nature Climate Change, October 21, 2019.
https://www.uarctic.org/media/1600119/natali_et_al_2019_nature_climate_change_s41558-019-0592-8.pdf
8) Canada’s Forests Flip to Carbon Source… Emitting 250 Mt annually, started net emissions in 2002 because of beetle kill. The rate of climate change is 10 to 100 times faster than Canada’s forests can adapt. “Scientists predict that increasing temperatures and changes in weather patterns associated with climate change will drastically affect Canada’s forests in the near future. With the rate of projected climate change expected to be 10 to 100 times faster than the ability of forests adapt naturally.” And, “Traditionally, foresters have used local tree seed for planting seedlings, as local populations were generally thought to be best adapted to the climate conditions of the site. However, with a rapidly changing climate, these local populations may not be able to adapt quickly enough, and while well-established adult trees can often withstand increased stress, seedlings are highly vulnerable.”
Seamus O’Regan, Minister of Natural Resources, Introductory Letter.
The State of Canadas Forests, Canadas Forests, Adapting to Change, Canadian Forest Service, 2020.
https://d1ied5g1xfgpx8.cloudfront.net/pdfs/40219.pdf
9) Australian Tropical Forest Flip from sequestration to emissions… Bauman et al,. analyzed a 49-year record across 24 old-growth tropical forests in Australia and found mortality has doubled across all plots in the last 35 years indicating a halving of life expectancy and carbon residence time. Losses were not offset by gains from growth and regrowth. Thresholds involving atmospheric water stress, driven by global warming, may be a primary cause of increasing tree mortality in moist tropical forests. “Model predictions indicate a doubling in average mortality risk across plots between the 1980s and 2010s, corresponding to a potential halving of tree life expectancy and carbon residence time… Carbon loss from a doubling of tree mortality was not offset by gains, converting these forests into biomass carbon sources.”
Bauman et al., state, “Many of the species in our plots are widespread across tropical Southeast Asia, offering a robust assessment of climate niche.” A personal communication with Bauman, where I asked if the above statement was one where Australian tropical forest mortality was an analog to Southeast Asian tropical forest mortality, reveals that on hindsight he would have modified this analog with Southeast Asian tropical forests to, “what makes the results of a marked increase in background mortality likely generalizable, to some extent, to other moist tropical regions, is the mechanism highlighted (atmospheric evaporative demand is increasing worldwide); the physiology of atmospheric water stress response is the same across tree species irrespective of their region of origin.”
Bauman et al., Tropical tree mortality has increased with rising atmospheric water stress, Nature, May 17, 2022.
(Researchgate, free account required) https://www.researchgate.net/publication/360691427_Tropical_tree_mortality_has_increased_with_rising_atmospheric_water_stress
10) Forest Mortality in Western North America between 1980 and the mid-200s with much of the increase happening recently rather than earlier…It is also pertinent that warming since the mid-2000s has just about doubled as of 2022, and that much of the western US forest mortality from bark beetles was not captured in these evaluations.
Sierra Nevada mortality has about doubled from 0.75 to 1.5 percent
Western Canada mortality has quadrupled from 0.6 percent to 2.5 percent
Eastern Canada has increased about 50 percent
Western US interior forests have more than doubled from 0.3 percent to 0.65 percent.
Pacific Northwest has tripled from 0.45 to 1.25 percent
McDowell et al., Multi-scale predictions of massive conifer mortality due to chronic temperature rise, Los Alamos National lab, nature Climate Change, December 21, 2015.
https://www.acsu.buffalo.edu/~dsmackay/mackay/pubs/pdfs/nclimate2873.pdf
from :
Peng, S. et al. A drought-induced pervasive increase in tree mortality across
Canada’s boreal forest. Nature Clim. Change 1, 467471 (2011).
and,
Van Mantgem, P. J. et al. Widespread increase of tree mortality rates in the western United States. Science 323, 521524 (2009)
11) More than half of known tipping points are now active up to 100 years ahead of projections… Nine Earth systems collapses have been identified by scientists as active: Arctic sea ice, Greenland ice sheet, boreal forests, permafrost, the Gulf Stream, the Amazon, coral, the West Antarctic Ice Sheet and parts of the East Antarctic Ice Sheet. Until 2018, the Intergovernmental Panel on Climate Change (IPCC) has assumed that tipping would not occur before 5 C of warming above preindustrial times, something that the worst-case scenario put well into the 22nd century. In 2018 however, IPCC lowered this limit to between 1 and 2 C above preindustrial times in both the 1.5 C Report and the Cryosphere Report. Lenton tells us, “The Intergovernmental Panel on Climate Change (IPCC) introduced the idea of tipping points two decades ago. At that time, these ‘large-scale discontinuities’ in the climate system were considered likely only if global warming exceeded 5 °C above pre-industrial levels. Information summarized in the two most recent IPCC Special Reports (published in 2018 and in September this year) suggests that tipping points could be exceeded even between 1 and 2 °C of warming.” Climate tipping is now active greater than 100 years ahead of projections.
Lenton et al., Climate tipping points-too risky to bet against, Nature, November 27, 2019
https://www.nature.com/articles/d41586-019-03595-0 |
University of Exeter Press –
http://www.exeter.ac.uk/news/featurednews/title_767753_en.html
12) King 2015 defines “anthropogenic emergence”… as the point where our climate warmed beyond its stable natural variability, as some point near or not too long after the year 2000, where we warmed beyond the 0.5 C.
King et al., The timing of anthropogenic emergence in simulated climate extremes, Environmental Research Letters, September 10, 2015.
https://iopscience.iop.org/article/10.1088/1748-9326/10/9/094015/pdf
Hansen 2017 “Young people’s burden…” defines the maximum warming or our old climate, or the maximum range of natural variability of our old climate as 0.25 to 0.75 C warming, with a midpoint of 0.5 C.
Hansen, Young People’s Burden: Requirement of Negative CO2 Emissions, Earth Systems Dynamics, July 18, 2017, Figure 12.
https://www.earth-syst-dynam.net/8/577/2017/esd-8-577-2017.pdf
Hansen 1988, 0.4 C “Smoking Gun”… Conclusions, “Our model results suggest that global greenhouse warming will soon rise above the level of natural climate variability. The single best place to search for the greenhouse effect appears to be the global mean surface air temperature. lf it rises and remains for a few years above an appropriate significance level, which we have argued is about 0.4• degrees C for 99% confidence (3o), it will constitute convincing evidence of a cause and effect relationship, i.e., a “smoking gun,” in current vernacular.”
Hansen et al., Global Climate Changes as Forecast by Goddard Institute for Space Studies Three-Dimensional Model, Journal of Geophysical Research, 1988.
https://pubs.giss.nasa.gov/docs/1988/1988_Hansen_ha02700w.pdf
Lenton’s tipping point article Since 2010, about 0.5 C… Lenton tells us more than half of known tipping points have activated since about 2010, which coincides well with climate change warming beyond 0.5 C.
Lenton et al., Climate tipping points-too risky to bet against, Nature, November 27, 2019
https://www.nature.com/articles/d41586-019-03595-0
Randers and Goluke 2020, permafrost 0.5 C… have identified a tipping point with permafrost collapse of 0.5 C warming.
Randers and Goluke, An earth system model shows self-sustained melting of permafrost even if all man-made GHG emissions stop in 2020, Nature Scientific Reports, November 12, 2020.
https://www.nature.com/articles/s41598-020-75481-z
13) WAIS Collapse Initiation Reversal, Feldmann and Levermann… Point of No Return PONR … Advanced Antarctic Ice Sheet modeling shows the West Antarctic Ice Sheet has a collapse initiation period where collapse becomes irreversible. If the warming mid-ocean waters that are responsible for the collapse can be returned to normal temperatures by mid-century, the collapse initiation can be reversed. Otherwise, the collapse becomes irreversible after mid-century.
Feldmann and Levermann, Collapse of the West Antarctic Ice Sheet after local destabilization of the Amundsen Basin, PNAS, November 17, 2015.
http://www.pnas.org/content/112/46/14191.full.pdf
14) Gigascaling Solar PV… We can look to many other industries to find how dramatically costs fall when their production is giga-gigasized. During the oil embargo in 1976 when Jimmy Carter was President, solar photovoltaic cells were $76 per watt. In 2020 their cost had fallen to $0.21 per watt. The cost in 1976 was 35,000 percent more than it is today.
This article was cross-posted to Climate Discovery.org.
[Bruce Melton is a professional engineer, environmental researcher, filmmaker, climate science education specialist, author, and director of the Climate Change Now Initiative founded in 2005. He has written over 500 reviews of academic climate science, lectures regularly, and has recently been involved in groundbreaking climate policy development where he was awarded a special achievement award by the Sierra Club for helping in the establishment of new climate policy and a safer limit to warming of “less than 1.0 degrees C above normal,” that reverses already initiated ecological collapse and climate tipping and restores extreme weather mayhem back to its former rare levels. You can see his climate science reviews and films at ClimateDiscovery.org, and his counterintuitively beautiful climate change photography at ClimateChangePhoto.org.]


Well done, Bruce.
I want to corroborate one of your particular points – removal of duff is a mistake. Fire at that level in any grove of trees taller than 50′ won’t threaten canopy. Dead (beetle-bark-killed in particular) and ‘doghair thickets’ should be downed and chipped or ‘masticated’, increasing the mulch layer. Yes, the chips will burn readily when dry, but the thicker the layer (up to the point of serious composting-heat generation) the more moist the chips, etc. are underneath.
One factor in particular that becomes the source and resource of many of the big fires on the eastern slopes of the Cascades, Rockies, etc. are the pines – particularly lodgepole pine – that are most susceptible to the pine-bark beetles and are often the dominant species in these drier regions. However, they are also part of a dryland, fire-friendly species’ strategy for long-term viability. They burn, but reproduce copiously. It’s encouraging to see the cycle of red ‘flags’ as the big trees die off, the stripped corpses standing bare for a few years, while the sea of green seedlings take over, and restart the cycle.
One other observation – thinning (not likely on the less commercial lodgepole pine forests) of over-dense forests not only reduces canopy density (which equals less fuel in the enhanced combustion zone where the wood and resin is most exposed to air via wind currents and fire-induced convection), but also reduces consumption of groundwater, leaving more for the bigger trees.