Ice storm brought down the power lines and it’s cold, cold, cold.
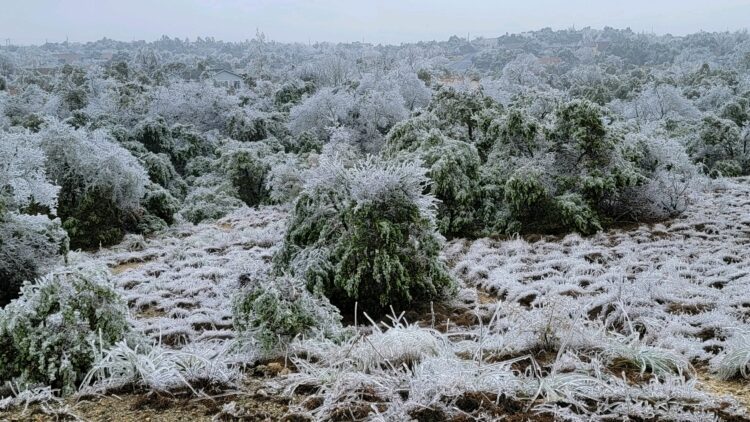
Windmill Run Park. Photos by Bruce Melton
By Bruce Melton | The Rag Blog | February 9, 2023
![]() Bruce Melton will be Thorne Dreyer‘s guest from 2-3 p.m. CST, February 9, 2013, on KOOP 91.7-FM in Austin and streamed on KOOP.org. They will discuss the recent Central Texas ice storm, especially in the context of climate change.
Bruce Melton will be Thorne Dreyer‘s guest from 2-3 p.m. CST, February 9, 2013, on KOOP 91.7-FM in Austin and streamed on KOOP.org. They will discuss the recent Central Texas ice storm, especially in the context of climate change.
Texas got it again. This time wasn’t as cold as the unprecedented Winter Storm Uri during Valentines Week 2021, but it was as bad as anything in memory. It was only 66 hours below freezing in 2023, versus 144 hours in 2021. It was bad because it was all freezing rain; freezing rain so heavy it created a major catastrophe west and southwest of Austin, with 358,000 customers without power at one time or another, or at 2.4 person per household average in Austin, 860,000 people without power just in Austin Energy’s service district.
What is going on with this increasing frequency of extreme events? Why did so many lose power and, exactly how is this climate change related?
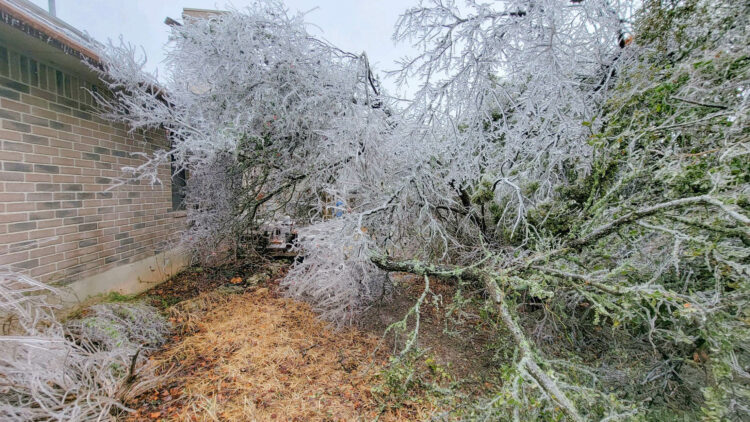
The author’s home in Oak Hill. There is a back deck beneath the downed limbs.
To start with, extreme cold is certainly a part of global warming because a warmer climate creates more extremes. This means more extreme heat as well as more extreme cold. See this American Association for the Advancement of Science article for more.
This storm, like Winter Storm Uri, Hurricane Harvey, and Superstorm Sandy, created the mayhem it did because of weak steering currents and a weak polar vortex. These are calling cards of climate change.
Steering currents are what drive weathers systems across the planet in a westerly to easterly motion and global warming creates polar amplification that can reduce the strength of steering currents and cause weather systems to stall. Polar amplification is the impact of climate warming where the Arctic warms faster than the rest of the world. This happens because of a shorter snow season on a warmer planet. Snow and ice reflect up to 90 percent of the sun’s light harmlessly back into space whereas soil, plants, rock and water absorb up to 90 percent of the sun’s rays and change them into heat that can then be captured by the greenhouse effect. This ice feedback effect causes the Arctic to warm faster than the rest of the planet
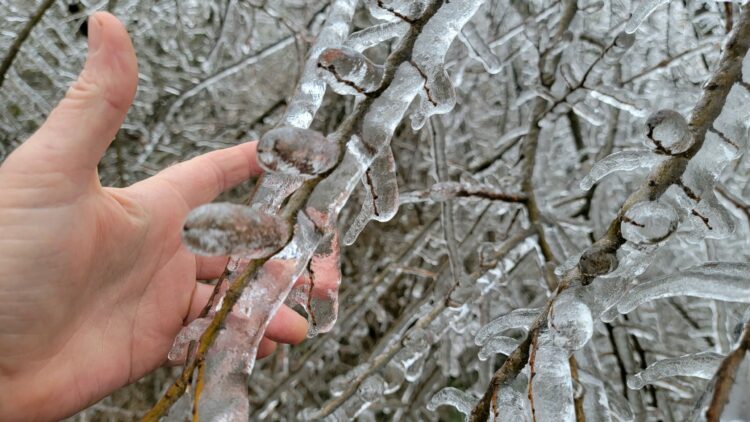
Oak Hill to Dripping Springs and Wimberley received about three quarters of an inch of ice accumulation.
Stalling weather systems do not happen all the time but it becomes more likely the warmer the planet becomes and the less warming differential there is between lower and higher latitudes. When weather systems move more slowly, the impacts they cause occur over a longer time period and this creates trouble. Winter Storm Uri stalled for a week, five days longer than normal.
This most recent storm stalled for four days, two more than normal, though the temperature across the region never fell below 28 degrees. Across the Austin region it just wasn’t cold enough for sleet or snow, and because it was so warm we did not have a great deal of trouble on at-grade roads even though elevated roadways all froze up. In Austin’s western suburbs and points further west, it was a few degrees colder though and the freezing rain accumulated to a much greater depth.
The other climate change cause of this ice storm was a partial collapse of the polar vortex of high speed jet stream winds that circle around the geographic North Pole. This was the second of these this year. The polar vortex strengthens in winter and keeps the really cold Arctic air confined to the far North. Collapses of this confining ring of winds are not unknown, though it appears these collapses are happening more frequently lately.
When a collapse happens, cold polar air separates from the polar regions and travels far south. It is not yet clear why the polar vortex collapsed this time, but we know what happened with Winter Storm Uri.
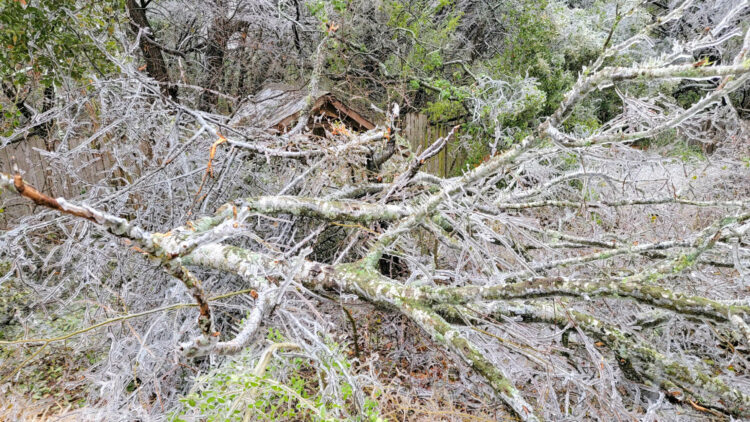
A seven foot tall small timberframe “playhouse” hidden behind downed limbs at the author’s home in Oak Hill.
In early January 2021, a bomb cyclone, or a very rapidly developing cyclonic storm in the North Pacific, caused a pulse of very warm air to be injected into the Arctic stratosphere, a phenomenon that is not new, but appears to be happening more recently lately. This sudden stratospheric warming caused the collapse of the polar vortex that then sent frigid air to Texas. Then, arctic amplification slowed the west to east movement of the jet stream and Uri stayed for a week. (See here, here, here and here)
Freezing rain does little harm if it comes in the normal amounts of a tenth of an inch or two as the event passes in a day or two, but extend that normal time of passing and ice accumulates beyond the structural threshold of trees and our built infrastructure. Trees collapsing from ice are easy to see but it is the engineering design criteria of our built infrastructure that are important in this discussion.
Our world’s infrastructure was designed by engineers using design criteria that have often been developed over generations, that are created so that whatever the engineer designs will not be harmful. They do this through careful observation of historic evidence of whatever pertaining to whatever it is they are designing. This legacy of design however, comes from our old climate where extremes were not near as extreme as today. This is why the blackouts happened with Winter Storm Uri. Texas’ electric generating and distribution infrastructure was designed for the past and did not take into account such cold as Uri brought. Likewise, with his ice storm we just endured, the tree trimming design criteria that kept frozen trees off our power lines in our old climate is not adequate for heavier ice loads in our new climate.
Other engineering dilemmas with climate change are easy to see. Drought in Lakes Mead and Powell in the American West, fed by that “other” Colorado River, is at an unprecedented level. Counterintuitively, drought has allowed conservation strategies to come into play that have been so effective that even with a growing population of the last 15 years, water demand — the amount of water actually used — has fallen, but regardless, Mead and Powell storage has fallen to historic low levels. Not so easy to see are other issues with flood engineering. The National Oceanic and Atmospheric Administration completed its first re-evaluation of rainfall intensity since 1970 in Texas (Atlas 14) in 2018. Rainfall intensity is one of the engineering criteria used to keep us safe from flooding. This re-evaluation showed what was once our 100-year storm is now our 25-year storm in a large swath inland from the Gulf to beyond Austin and Houston.
Very troubling with flood engineering and our new climate however, is the capability of the statistical evaluations used (that are used with most climate change data), to accurately evaluate the changes we are seeing. For statistical data evaluations to be accurate, the data must be stable or not moving. In other words, before about the turn of the 21st century, our climate data was stable. All the weather we endured up until 2000 was similar to all the rest of the data from the time record keeping began over 100 years prior. Since 2000 to 2010 or 2015 we have warmed beyond the boundaries of our former stable climate that maxed out between 0.5 degrees C and 1.0 degree C warming above the average of our old climate from the middle and late 19th century. This 0.5 to 1.0 degree C boundary is also known as the upper limits of the natural variation of our old climate. (See here, here, here, here, and here)
So what is happening is that these statistical evaluations of our weather data are averaging in five or 10 years of data from a climate that is warmer than our climate was when our engineering design criteria were developed. This biases the warmer data or understates it’s significance. So the deal with the 100-year storm now being the 25-year storm is understated. The 100-year storm is now more frequent, or maybe much more frequent than the 25-year storm. (see here, here, here, here and here)
This same conundrum, called the non-stationarity problem, inflicts almost all weather data that defines our engineering criteria for a safe world. So today, infrastructure or other products that are designed to engineering standards that incorporate even the latest weather data, are underdesigned for our new climate. And, this is if our new climate were to suddenly and magically stabilize. Further warming creates nonlinearly more extreme extremes.
What we have been enduring then, are likely the most common of weather events in our new climate like the one-, two-, and five-year storms. It is almost certain that even with magical halting of warming we would still see the more rare and much more extreme events like the 10-, 25-, and 100-year events.
The solution comes in two parts: One is to restore our old climate, fast. If we allow further warming to the commonly established target of 1.5 degrees C above normal, imagine how much more extreme the weather will become, compared to what we have seen with current warming at 1.2 degrees C above normal, when the maximum of our old climate was 1.0 degree C above normal.
The other part of the solution is to reevaluate our infrastructure design criteria to include worse than the worst-case scenario. Simply designing to what engineers believe is the worst-case scenario is no longer adequate, as is now becoming so obvious.
[Bruce Melton is a professional engineer, environmental researcher, filmmaker, climate science education specialist, author, and director of the Climate Change Now Initiative founded in 2005. He has written over 500 reviews of academic climate science, lectures regularly, and has recently been involved in groundbreaking climate policy development where he was awarded a special achievement award by the Sierra Club for helping in the establishment of new climate policy and a safer limit to warming of “less than 1.0 degrees C above normal,” that reverses already initiated ecological collapse and climate tipping and restores extreme weather mayhem back to its former rare levels. You can see his climate science reviews and films at ClimateDiscovery.org, and his counterintuitively beautiful climate change photography at ClimateChangePhoto.org.]
- Read more articles by Bruce Melton on The Rag Blog.
- Listen to Thorne Dreyer’s Rag Radio interviews with Bruce Melton.