
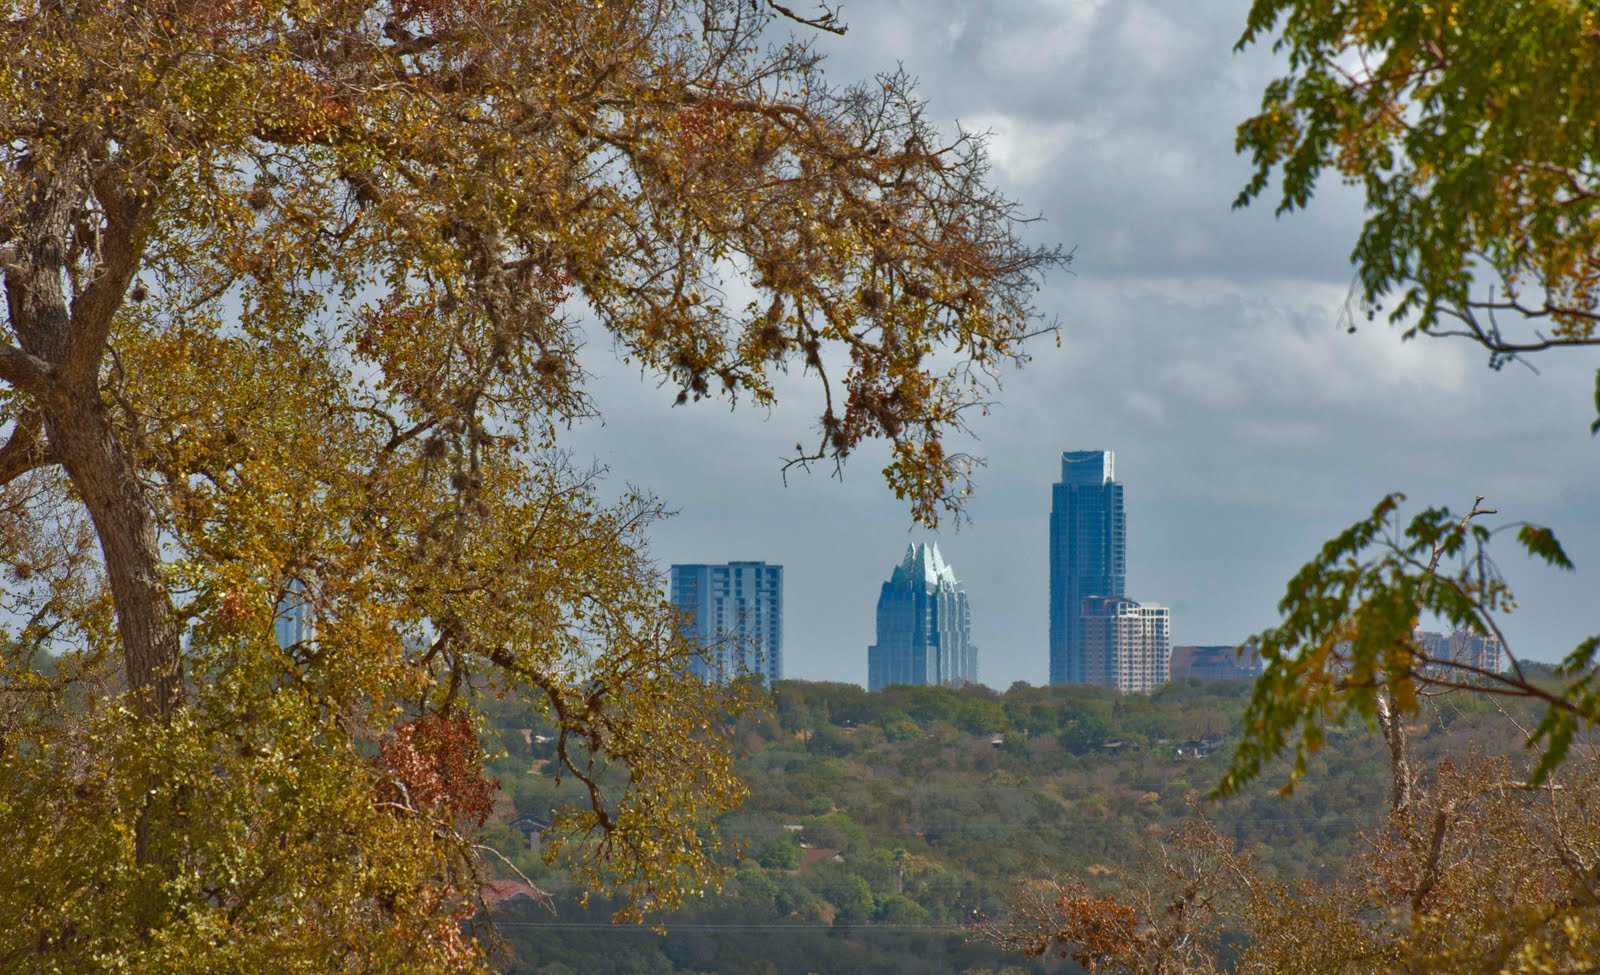
Downtown Austin seen from near the intersection of Loop 360 and US 290/71 West. This photo was taken in early September 2011. The brownish yellow- and red-leaved trees in the left and bottom right foreground are elms. They naturally shed their leaves early during our hottest summers and September is still summertime in Central Texas! The fall leaf drop does not start until October. This year is different however. Normal drought stress creates a leaf drop where elms go dormant, their leaves yellow and fall to the ground, very similar to the normal autumn leaf drop. In this year’s unprecedented drought however, many of the elms around Austin turned bright brown or reddish brown. This more than likely means they have died. In the middle ground of the photo you can also see many yellow, brown, and gray trees that have already gone dormant or died. A preliminary report by the Texas Forest Service has looked at forest mortality across Texas and tells us that up to a half billion (with a “B”) trees may have died in this drought. — B.M.
Have we crossed a threshold?
Welcome to climate change in Texas / 2
By Bruce Melton | The Rag Blog | January 4, 2012
[This is the second in a three-part series.]
AUSTIN — The driest 12 month period in Austin, since record keeping began in 1854, happened October 2010 to September 2011. The 100 degree day record was more than shattered, it was obliterated. Three times in the last six years Lake Travis inflows have fallen below the minimum levels set in the Drought of the 50s.
The Lower Colorado River Authority Board of Directors has voted to take drastic measures. They have received permission to deviate from the Water Management Plan to significantly cut back or even cut off water to farmers next year.
Obviously, this string of droughts is as bad as they come, or is it? The news that the drought will be over when La Niña goes away is ever present, but will it really go away when La Niña leaves?
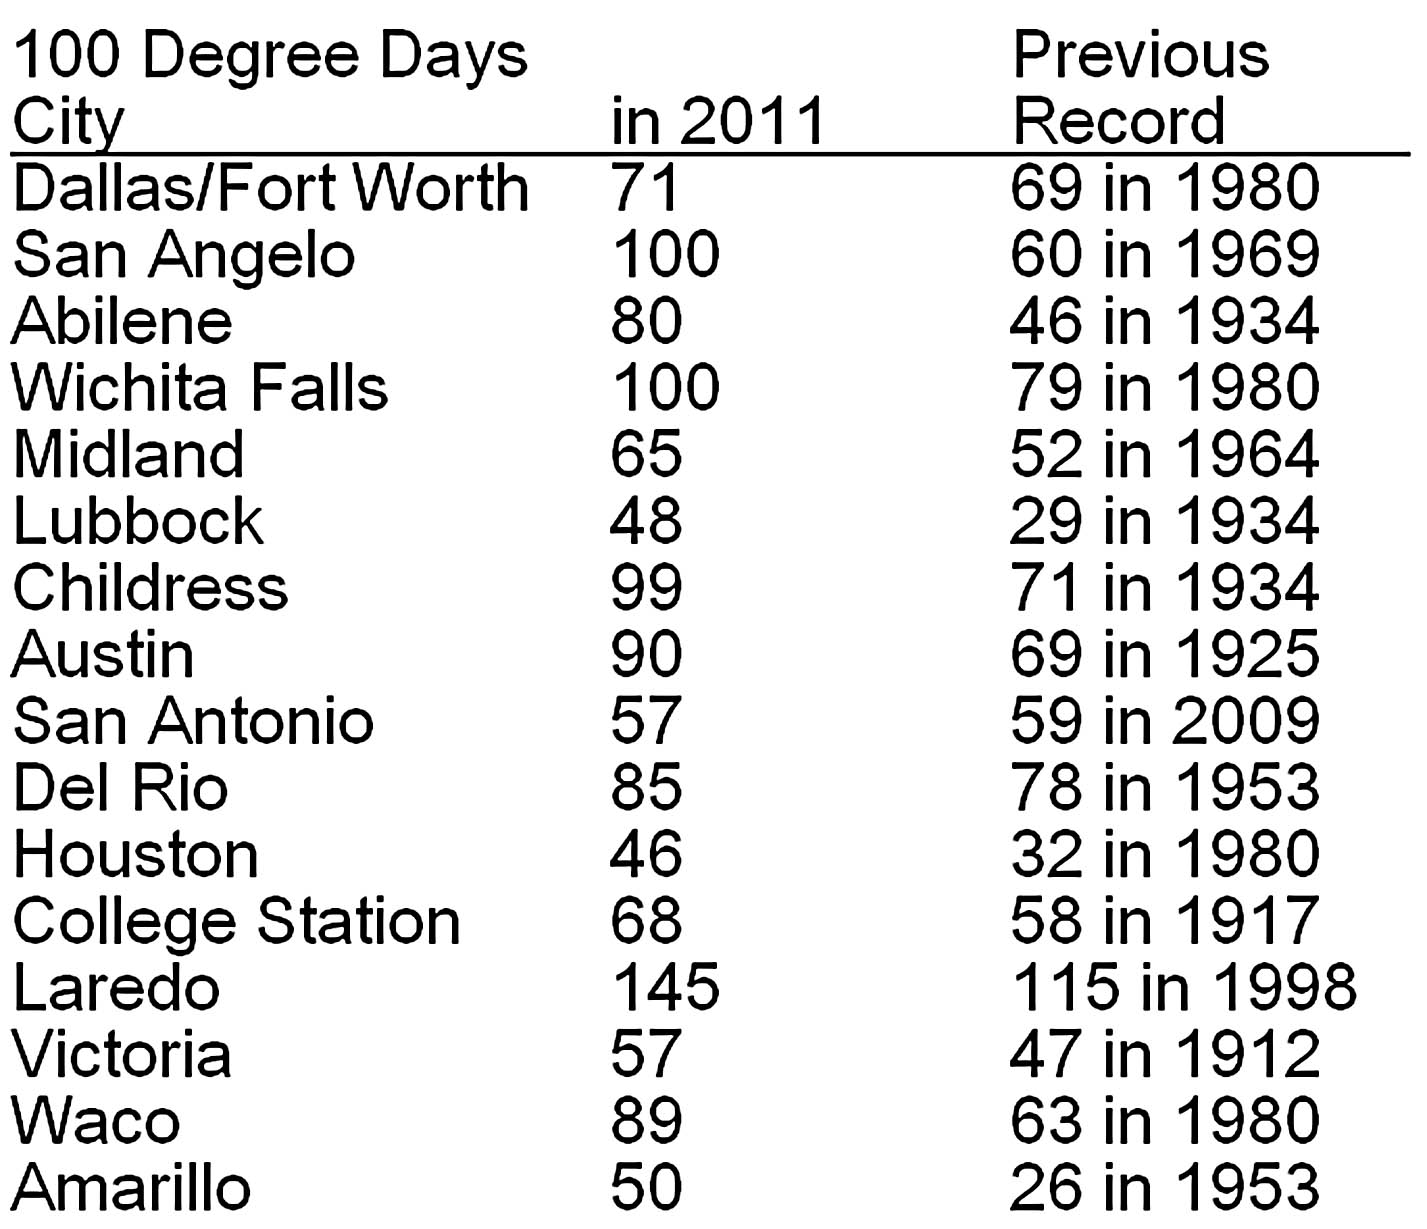
And what about all this heat? What about all of these 100 degree-plus days that we have had recently? How big was this 100 degree day record that we broke and how does all this unprecedented heat influence this string of droughts?
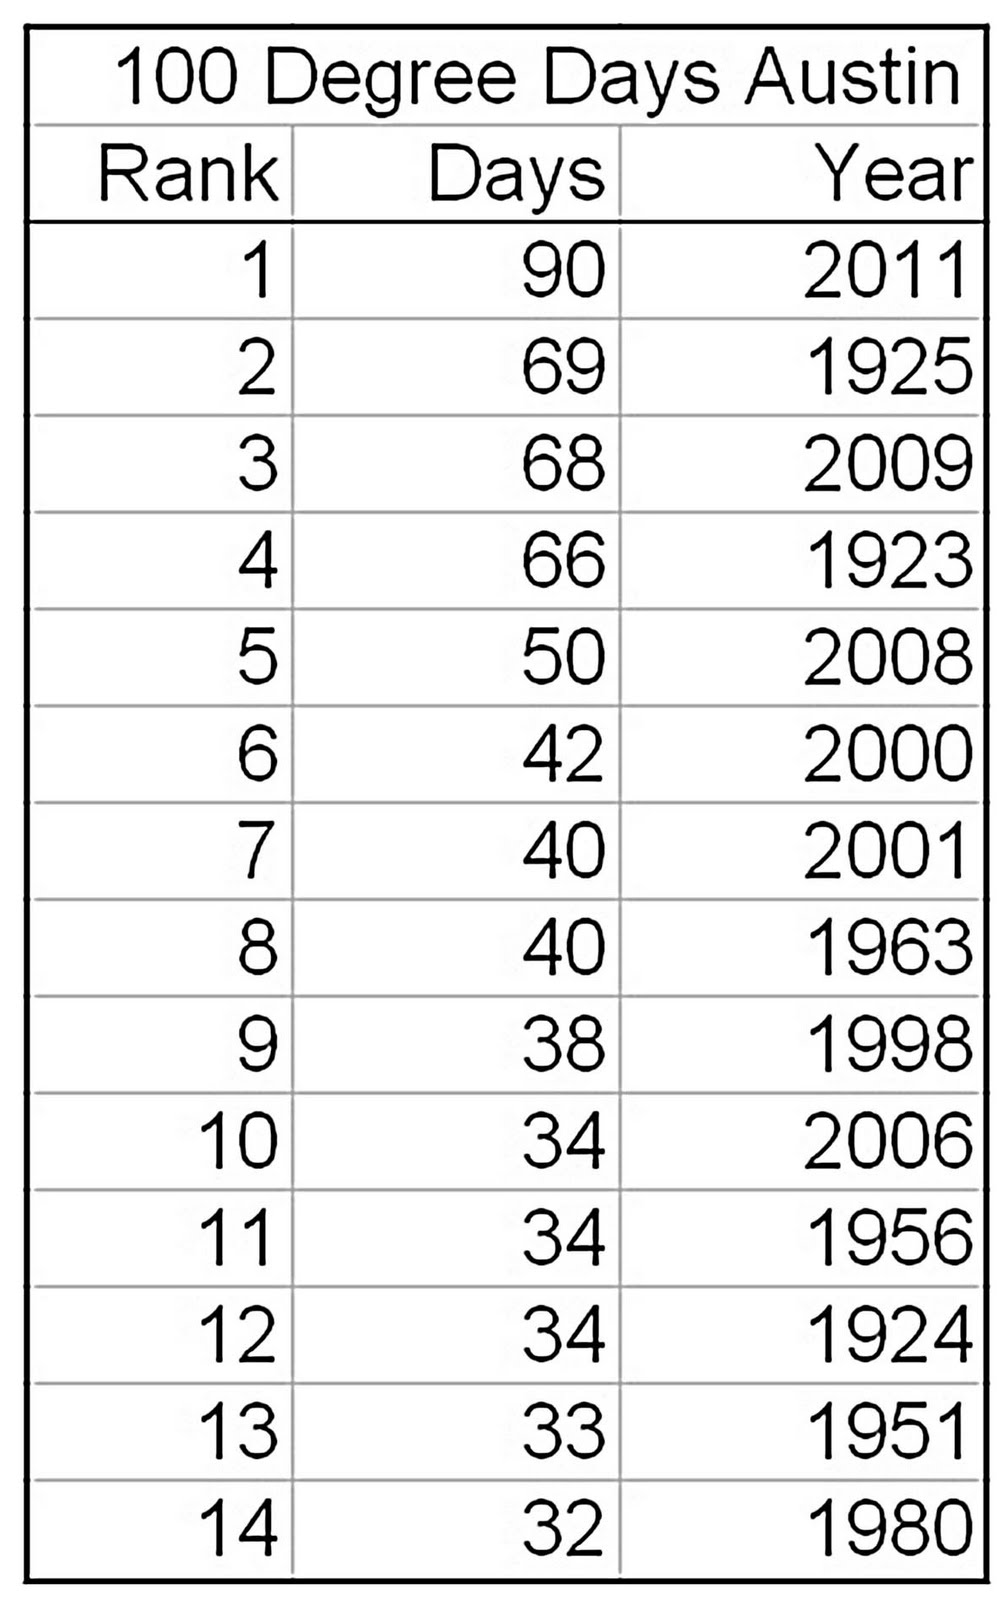
The official record shows that we beat the 100 degree day record by at least 30 percent this year. The previous top two records for Austin were 69 set in 1925 and 66 set in 1923. The state climatologist (John Nielson-Gammon) calls 2011 an outlier because we endured 21 more days of 100 degree temperatures than the previous record of 69 days set in 1925.
So, what is an outlier and what do scientists do with them? Outliers are pieces of data that for some reason do not belong to the sample being analyzed. In this case we are analyzing the number of days every year with high temperatures above 100 degrees.
An example describing outliers could be the normal water level in the closed basin lakes in Nevada and Utah. The Great Salt Lake is a 1,700 square mile remnant of the great 8,500 mile Lake Lahontan from ice age times. Lake Lahontan grew and shrank maybe dozens of times over the last 100,000 or so years. The evidence is clear in the raised beaches hundreds of feet above the existing water level and the submerged forests of preserved stumps hundreds of feet below current water levels.
The Great Basin has no natural discharge in this area so the level of Lake Lohontan is an indicator of how much precipitation falls there. When the climate was really warm (like today) or really cold, like any of the two dozen or more abrupt climate changes over the period, rainfall was low.
Statistically, rainfall data from the wet periods would be deemed outlier if they were mixed in with rainfall data from the dry periods. Different climates create different data. Another example would be a broken thermometer. If it is 165 degrees in February, something is broken.
Our State climatologists calling the 2011 heat wave of 90 days of 100 degree plus temperature an outliers means that this piece of data is suspect and is likely the result of an error or fundamental system change. The years 1923 and 1925 were certainly hot, but surrounding weather stations from Del Rio to Dallas come nowhere near the intensity of heat experienced at the Austin weather station.
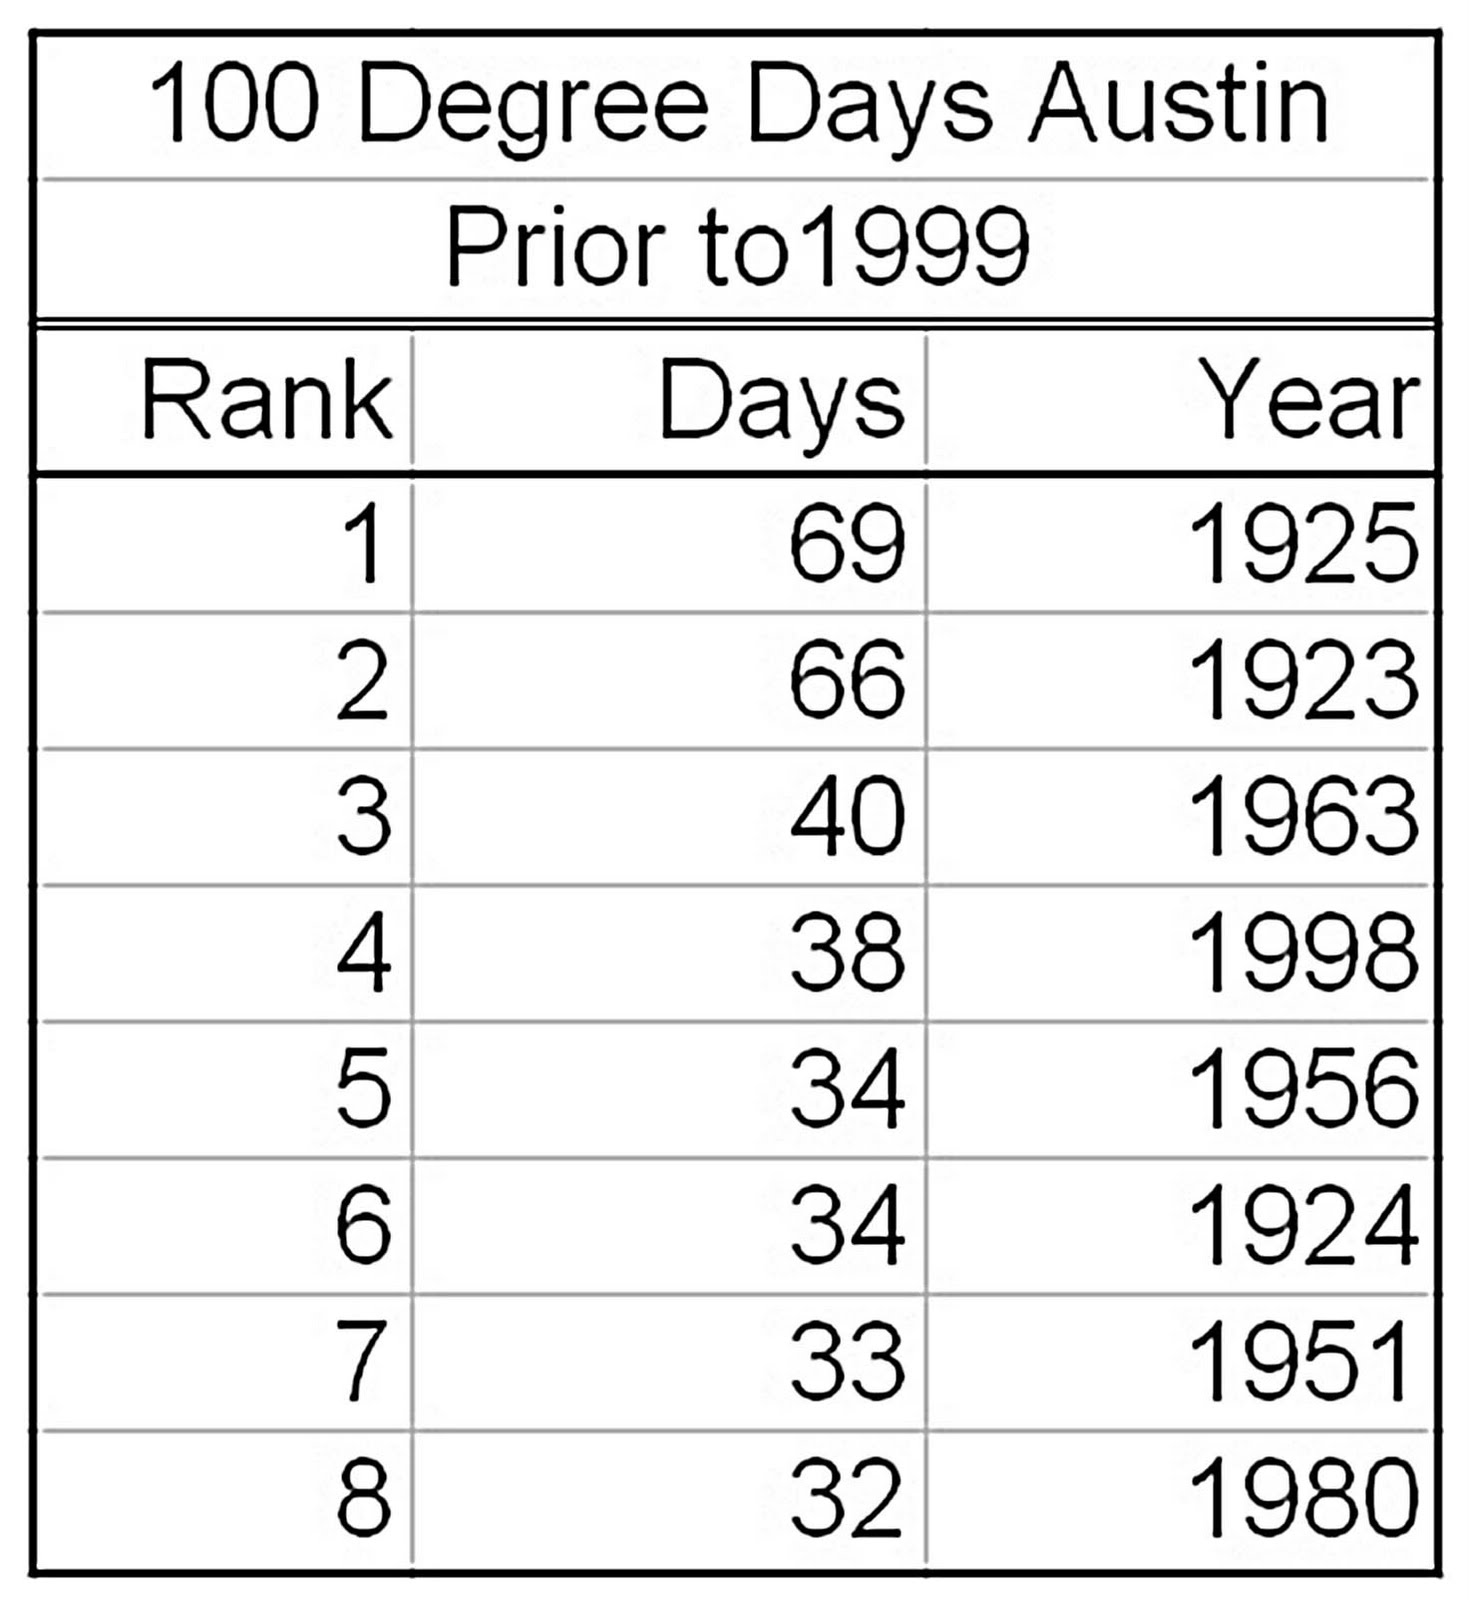
 Has our regional climate seen a fundamental change? Why did this outlier occur and what does it mean? What’s up with 1923 and 1925? To try and answer these questions we need to first clean up the rest of the data. If we look at 100 degree days before the year 2000, we find that 1923 and 1925 were 65 and 73 percent greater than the third ranked most extreme summer ever recorded in Texas.
So if 2011’s 90 days of 100 degree heat was an outlier, and 2011 was 30 percent greater than the previous record, then 1923 and 1925 are outliers two times over!
Now you are thinking, why did I say before 2000? The weather really started freaking out about the turn of the century. This is when “The Big Melt,” as the climate scientists call it, started in Greenland. It’s when the great pine beetle pandemic in the Rockies really got going. Just a few years later is when we started having snowmaggedons and snowtastrophes in the northeast and northern Europe where Arctic warming has enhanced the jet stream, increasing winter storms across the Northeast and other areas.
The ranking of 100 degree days in Austin prior to 1999 shows the tremendous gap between the 1923 and 1925 records and the rest of the pack. These records stood for 75 years. But if you disregard the 1923 and 1925 outliers, seven of the top 10 100 degree day records have been set since 1998.
 Beyond rational association, as well as using statistical data validation tools, it is significantly likely that these two records are in error for some reason and should be ignored. When the true nature of the 1923 and 1925 records is understood, the incredible record smashing that we thought happened with 100 degree days in 2011 more than doubles! What I am getting at here is that we have likely crossed one of those climate thresholds the climate scientists keep talking about.
Does more evidence cast doubt on the 1923 and 1925 records? The years 1922, 1923, 1925, and 1926 are incomplete. They have a lot of missing data. These are the last years in the record to have missing data and there were no years for the previous 18 years that had missing data. Prior to 1903, years with missing data were much more common.
Then there are the rainfall records. Rainfall is an excellent indicator of extreme heat. The hotter it is, the greater is the evaporation and the drier things are. This allows the temperature to become even hotter because moisture in the air prevents the temperature from going even higher. It’s a feedback loop.
Nielson-Gammon says that the extreme heat was responsible for 90% of our unprecedented heat records in Texas in 2011 and that climate change was only responsible for 10% (0.5 degrees.) (Nielson-Gammon’s 90% is 4.9 degrees out of the 5.4 degrees Texas’ temperature was above average in the summer of 2011.)
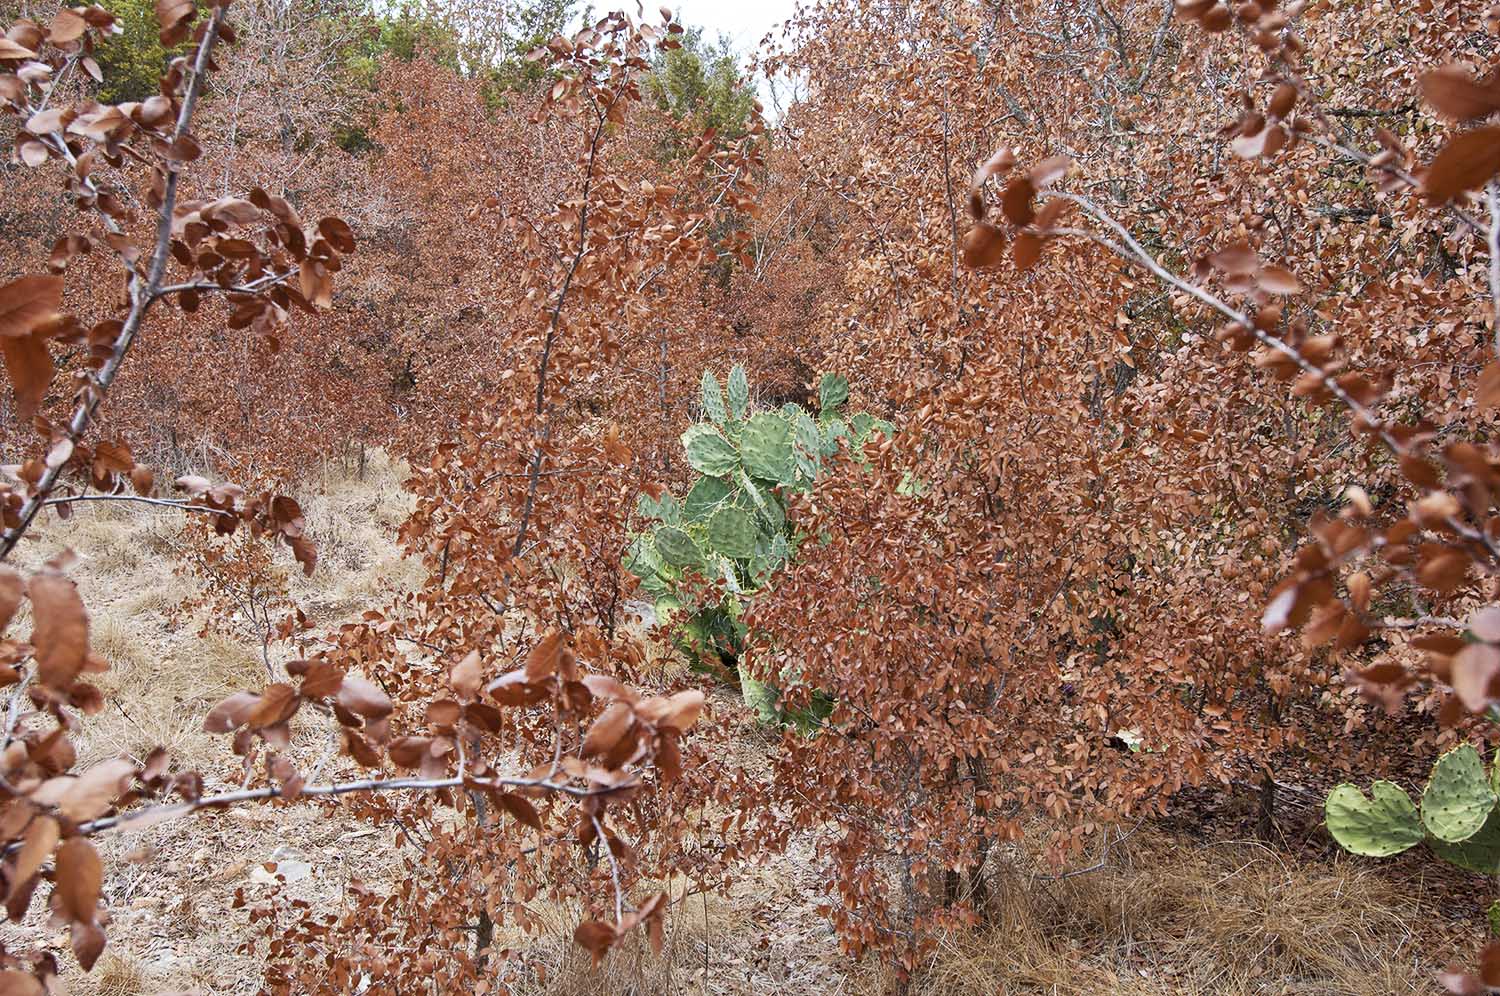
This visually startling photo was taken in southwest Austin. These trees are young elms and they have very likely been killed by the drought and have not just gone dormant. They are maybe 15 to 20 years old. The photo was taken in mid-September and these trees normally do not ever turn this color, especially at this time of year. When these trees go dormant, their leaves yellow, not redden, before they fall. Young trees are especially susceptible to the effects of drought because of their immature root systems. It is also important to note that the 500 million trees killed by the drought, cited by the Texas Forest Services, are all trees with a trunk diameter greater than five inches. None, or very few of these trees, or countless others across the state, come close to five inches. — B.M.
Based on numerous evaluations of ongoing climate changes from Stanford, Purdue, the National Center for Atmospheric Research (NCAR) and the U.S. Global Change Research Program (USGCRP), Nielson-Gammon’s evaluation is dated. According to the IPCC and the Climate Change Congress in Copenhagen, our climate is progressing along the worst-case scenario.
These assessments and evaluations (Diffenbaugh and Ashfaq 2010) show that we can expect the hottest season experienced since 1950 (including the drought of the 1950s) to happen two to three times within the next century, four to five times in the 2020s, and largely become average conditions after 2030.
Aigou Dia (NCAR) tells us that we will see Dust Bowl conditions as the average climate across much of the nation by the decade 2020 to 2030. By 2030 to 2040, Dia says the Palmer Drought Severity Index for most of the country will be worse than during the Dust Bowl, with some parts of the country being unimaginably worse than the Dust Bowl.
The USGCRP, founded by President Reagan, says that Austin will be nearly 50 percent hotter than the Sonoran Desert Researcher Station (the one with the giant saguaro cactus outside of Tuscon) beginning about 2080. We can expect every year to have 90 to 120 days of 100 degree heat. The average number of days of 100 degree-plus at the Research Station is 87. In Austin the average number of days over 100 degrees is 11.
Also remember, the three studies above are an excellent demonstration of the “conservative climate science” reality. All three (as do almost all climate research) show the results of modeling that is based on the A1B scenario. This scenario is what is commonly referred to as the “most likely” scenario. It is one where we follow a path similar to Kyoto. This is the climate path that we were expected to follow.
But the United States’ refusal to ratify Kyoto, as the only nation on the planet to do so, has almost certainly relegated the A1B scenario to the infeasible category. The path that our actual global emissions are on is the A1FI (Fossil Intensive) scenario, otherwise known as the worst-case scenario. So as outrageous as it sounds, these projections are conservative — impacts will likely be more extreme.
Back to last summer: Rainfall makes a huge difference with summer temperatures. May, June, and July of 2008 saw 22 inches of rain. That summer we only experienced three days of 100 degree heat in Austin.
The second driest period of the drought of the 50s had just an inch more rain than we had here in 2011 (1956 at 12.2 inches) and they had 34 days of 100 degree heat. We had nearly three times that many days over 100 last summer with virtually the same rainfall. What about the big heat waves in 1923 and 1925?
 In 1925 we had almost 13 inches of rain. This was great for the heat wave-inducing temperature feedback that supposedly produced 69 days of 100 degrees-plus temps that year. But what happened in 1923 with 66 days over 100? It rained 51 inches in 1923! Why in the world were there so many 100 degree days in that year? May through August 1923 had six inches including three inches-plus in July. February through April saw 12.5 inches. In 1923 there was no extreme dryness contributing to the 66 days over 100 degrees supposedly recorded.
The years where 100 degree days do not match up with extremely low rainfall in the record are too numerous to print here. The relationship that our State Climatologist talks about simply is not well-supported. So, glaringly, there is a problem with Nielson-Gammon’s hypothesis. Extreme drought may be responsible for the heat wave feedback, but it does not appear to have a definitive relationship with the 14 most extreme 100 degree day years in the record. What about the rest of Texas in 2011?
The only number two-ranked record was San Antonio. They had 57 days of 100-plus this year, second to 59 days they endured in 2009. Prior to 1998, the most San Antonio had seen was 33 days over 100 in 1948. All the rest suffered through the hottest summer ever. A few of them shattered their previous records. The remainder annihilated their records. But most important for this discussion, notice how the 1920’s are completely absent from the previous record list except for Austin.
Even if Austin’s 1923 and 1925 records are absolutely valid, something big has happened across Texas. Have we really crossed a climate threshold? As unambiguous as all of these obliterated 100-degree day records seem to be, it may be decades before we know. Remember when the climate change debate began 30 years ago and the climate scientists said it could be 20 or 30 years before we knew for sure if it was real? Same smell here. A scientific certainty requires lots of data.
Scientific truths and moral truths however, are very different things. A murder suspect sentenced to death based on circumstantial evidence… is sentenced to death by moral truths. But circumstantial evidence — moral truths — are almost never allowed in science.
Climate scientists have been telling us for nearly three decades that these kinds of things would happen: that the weather would become more extreme, that droughts would become the norm, that extreme heat waves would surpass all heat waves of the past, that we would see desertification and forest die-off, agricultural failure, and unimaginable water shortages.
They told us that all of these things would be unprecedentedly extreme. They have been telling us that the longer we delayed the greater would be the extremeness of the changes that we would have to endure. They told us that it was not the average temperature increase that would be the problem, it would be the extremes.
Many of us have heard by now that it was much drier during the droughts of the 1600s, 1700s, and 1800s before reliable record keeping began in Texas. These droughts however, do not hold a candle to what scientists have discovered to be true “megadroughts.” Two of them happened between the 900’s and about 1350. These droughts saw rainfall drop to 25% of normal and they lasted for centuries — hundreds of years! These periods were when Lake Lahontan dropped so low.
There is also evidence that large portions of the Great Plains desertified, changing to a sea of shifting sand. This desertification was much larger than that at the turn of the 19th century that fostered the term “Great American Desert.”
Sure, there have been bigger droughts and bigger fires in the early 1900’s or the 1800’s or the 1300’s or 3,000 years BC, but our complicated society did not have 1.7 million people in the Austin-Round Rock Metropolitan Area then. Now the climate scientists are warning us of upcoming weather far more extreme than our civilization has ever experienced.
This is no longer business as usual. We have to do something. The only way that we are going to overcome the momentum of political ignorance though is for each and every one of us to do something.
I’m not talking about fluorescent light bulbs or Priuses. Each and every one of us CAN make a difference. Contact your local, state, and national leaders and tell them to listen to what the people, not corporations, are telling them to do about our climate. Tell them that this is the single most important issue of our time and they need to treat it like it is so.
Tell them what professor Alley says in his book Earth: The Operators Manual. Alley says that fixing our climate will be no more difficult than creating our planetary wastewater collection and treatment infrastructure.
Then tell them that those who say it will ruin our economy are the same ones who tell us that climate change is not real, it is not bad, it is good for us, or it is a world-wide conspiracy by almost all climate scientists.
And ask them why is it that we still believe these climate change deniers when they tell us the solutions to the climate challenge will ruin our economy?
[Bruce Melton is a professional engineer, environmental researcher, filmmaker, writer, and front man for the band Climate Change. Information on Melton’s new book, Climate Discovery Chronicles, can be found, along with more climate change writing and outreach, critical environmental issue films, and the band’s original blues, rock, and folk music tuned to climate change lyrics at his website. Read more articles by Bruce Melton on The Rag Blog.]
- Listen to Thorne Dreyer’s December 30, 2011, Rag Radio interview with Bruce Melton.
References:
Preliminary estimates show hundreds of millions of trees killed by 2011 drought:
Texas Forest Service, December 19, 2011.
http://txforestservice.tamu.edu/main/default.aspx
2020 to 2029 will include three to five droughts as bad as or worse than the worst drought that we have seen since 1951:
Diffenbaugh and Ashfaq, Intensification of hot extremes in the United States, Geophysical Research Letters, August 2010. http://www.stanford.edu/~omramom/Diffenbaugh_GRL_10.pdf
Dust Bowl conditions will be the average condition beginning in 2020:
Dia, Characteristics and trends in various forms of the Palmer Drought Severity Index 1900 to 2008, Journal of Geophysical Research, March 16, 2011, revised. `
Press Release: http://www2.ucar.edu/news/2904/climate-change-drought-may-threaten-much-globe-within-decades
Article: http://www.cgd.ucar.edu/cas/adai/papers/Dai_JGR2011.pdf
100 degree days:
Global Climate Change Impacts in the United States, A State of Knowledge Report from the U.S. Global Change Research Program, 2009. http://downloads.globalchange.gov/usimpacts/pdfs/climate-impacts-report.pdf
Weather Data: U.S. Weather Service
Lake Travis Information: Lower Colorado River Authority
Megadroughts of the last 10,000 years:
Cleveland, Extended Chronology of Drought in the San Antonio Area, 2006. Tree-Ring Laboratory, Geosciences Department, University of Arkansas.
http://www.gbra.org/documents/studies/treering/TreeRingStudy.pdf
Cook, et. al., Long Term Aridity Changes in the Western United States, Science 306, 1015, 2004.
http://www.sciencemag.org/content/306/5698/1015.short
deMenocal, et. al., Coherent high and low latitude variability during the Holocene warm period, Science, June 2000.
http://www.ncdc.noaa.gov/paleo/pubs/demenocal2000/demenocal2000.html
Miao, et. al., High resolution proxy record of Holocene climate from a loess section in Southwest Nebraska, Paleoclimatology, September 2006.
http://snr.unl.edu/sandhills-biocomplexity/download/miaopalaeo2007.pdf
USGCRP History of drought variability in the central United States – implications for the future, 1999.
http://www.usgcrp.gov/usgcrp/seminars/990120FO.html
Fixing our climate will be no more difficult than creating our planetary wastewater collection and treatment infrastructure:
Alley, Earth: The Operators Manual, W.W. Norton, 2011.


To control drought cycles, first we have to control the jet stream. But, as Mark Twain said, “Everyone talks about the weather but no one does anything about it.” Praying won’t move the jet stream and neither will liberals whining about the ozone layer.
Fisher:
YOU MIGHT TRY READING THE ARTICLE BEFORE POSTING THIS INANE COMMENT.
OZONE LAYER DEPLETION IS A SEPARATE AND DIFFERENT PROBLEM THAN GLOBAL WARMING. LOOK IT UP FOOL..
AND SCIENCE IS NEITHER ‘LIBERAL’ NOR CONSERVATIVE!!!
AS FOR “WHINING,” AREN’T YOU WHINING ABOUT WHINING???