
Stories of climate change survival, our current emergency, and new solutions to this existential crisis.

By Bruce Melton | The Rag Blog | February 10, 2022
AUSTIN — The Texas winter storm disaster was caused by both climate change and poor planning. Climate change is making extreme weather more extreme, and energy generation planning in Texas did not fully take into consideration cascading feedbacks, simultaneous catastrophes, and the extent to which our climate has already created more extreme weather based on warming we have already measured. Today, because of 30 years delay in climate pollution reform action, we find ourselves in a world vastly different from the one where we developed not only our historic climate pollution reform strategies, but from when we developed engineering criteria to make us safe.
Irreversible climate tipping systems are now active 100 years ahead of schedule and they complete their activation periods and become irreversible with no further warming. Implications of impacts from these tipping systems are profound with large parts of Earth becoming uninhabitable, but because climate science cannot robustly determine if these extreme events are because of climate change or not, we face further delay locking in irreversible existential scenarios.
This article is about the science of why repeatedly unprecedented extreme events we are now enduring are caused by climate change, and includes a compilation of stories from citizens in Austin who were directly impacted by the fury of the astonishingly extreme and unprecedented winter storm of 2021.
Eleven days before the Valentine’s Day Blizzard Disaster it was 85 degrees in Austin. Eleven days after, it was 86. At the coldest, it was two on my good thermometer in the hills southwest of town. At my family’s house we retained power all except a few hours but across Texas a total of 69 percent of Texans, 20 million people, were without power for an average of 42 hours. (1) All across the region, the temperature plummeted inside homes without power, some to below freezing. Then the cascading feedbacks and simultaneous catastrophes vastly complicated the disaster. Up to 978 people died because of this storm and the inadequacies of our current culture. The disaster cost $200 to $295 billion, up to more than the cost of Hurricanes Harvey and Katrina combined. (2) It wasn’t a blizzard by the standard meteorological definition, but to most Texans, this epic event was most certainly a blizzard; a blizzard so extreme, to us it was unfathomable that conditions like these could ever occur in Texas.
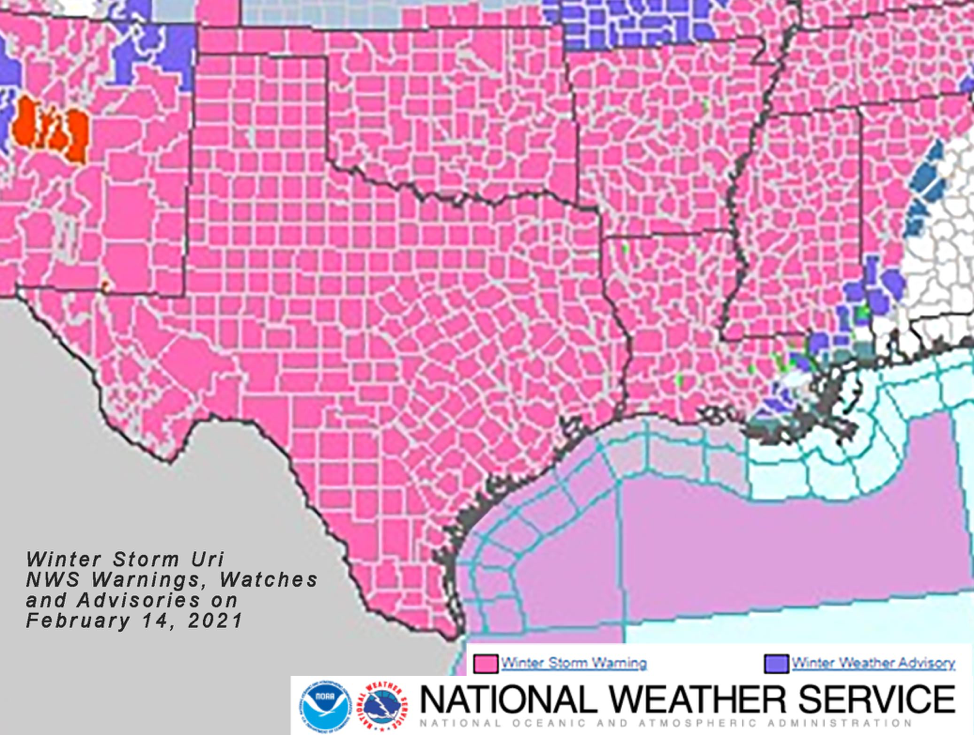
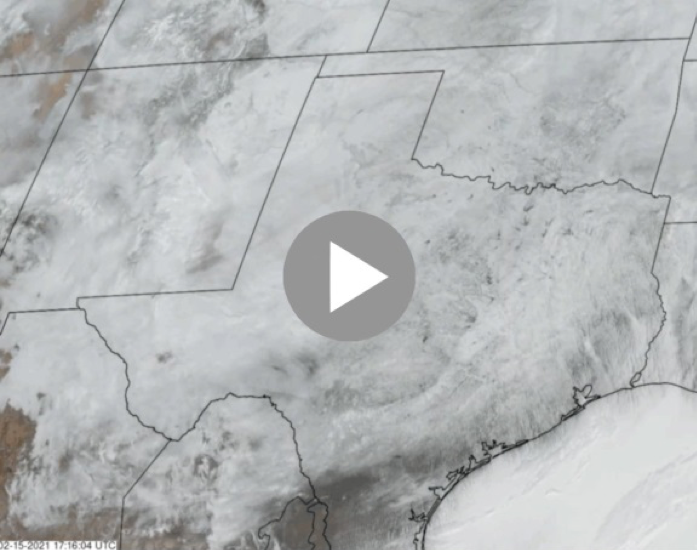
Freezing rain began February 11. This is when the first Central Texans lost power; power that was to remain out for a minimum of 10 days for some throughout the depths of this wildly unprecedented weather event. On February 12, record breaking cold air began moving in with continued freezing rain and sleet. Then, late on Valentine’s Day, February 14, the blizzard hit and the gates of the Arctic were blasted off their hinges.
A bomb cyclone collapses the polar vortex
It started when a bomb cyclone in the North Pacific teleconnected into the stratosphere about the first of the year causing the stratospheric temperature to rise 73 degrees Fahrenheit in five days. This phenomenon is called sudden stratospheric warming. (4) These things have happened before, but it appears they could be happening more often lately and this one seems to have teleconnected to the North Pole and caused the polar vortex collapse that was responsible for this ice bomb disaster. (5) The polar vortex is a normal circulation of upper level winds around the poles that sets up every winter. It collapses every few to several years on average and often results in extreme winter weather. The science of these collapses and their causes is not yet certain, mostly because the climate change connection is all rather new as our climate has really only recently changed beyond its natural variability.
The morning after the blizzard on February 15, I was attempting to retrieve our daughter from her apartment without power in my custom four-wheel drive Suburban I use for filming wilderness climate change impacts across North America. I really wanted to get it out in the eight inches of snow on our roads. I chipped my way in to the driver’s door and the starter just clicked. That cheap battery with the cables that wouldn’t stay tight… Never again.
When I pulled on the hood lever, it magically popped up, eight inches of snow and all. Around the front of the truck I waded in the drift, certain I would have to clear the snow load to get the hood up, but it stayed. Lucky me?
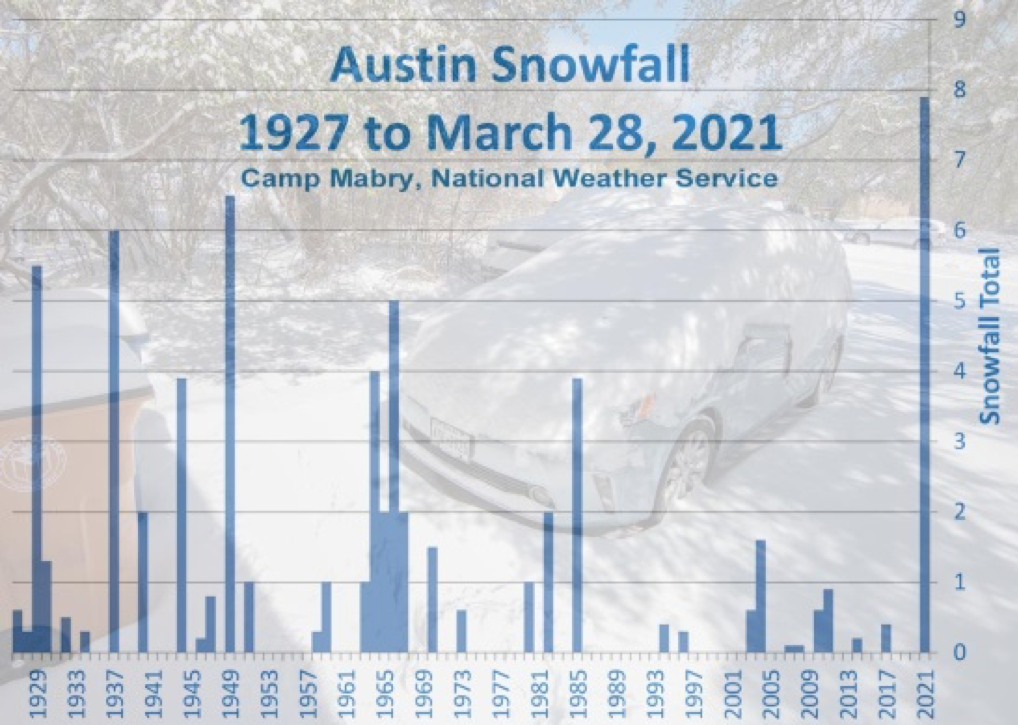
As I tightened the battery cables under the hood loaded with more snow than I have ever seen in Austin, with more snow in one year than Austin had accumulated total since 1985, the hood that was loaded with 8 inches of snow came down on the back of my head slamming my teeth into the fender.
Then my wife’s routine and minor urinary tract infection she had been self-treating because of Covid, and self-treating because of her work load teaching visually handicapped kids on Zoom, and then self-treating because of dangerous conditions to get to the doctor; her infection went septic. Sepsis has a 50 percent mortality rate.
The blackouts, the water and communications systems failures, the natural gas distribution failures and ice-locked roadways without snowplows; this disaster happened because the Texas electricity grid is a for profit only platform with few mandates for generation safeguards, meaning few emergency precautions. This disaster happened because of lack of oversight of our energy generation infrastructure and poor planning in the face of an already warmed climate where scientists have been telling us cold weather extremes are a part of climate change. (6) The temperature stayed below freezing at Austin Bergstrom Airport for 164 hours, beating the old record of 112 hours set in 1951 by an astonishing 46 percent. (7)
My friend Mike told me:
I’ve never tried to sleep in my Chevy Bolt Electric vehicle because it is a fairly small vehicle. But as the sleet starting pelting the windows of my house, I decided to take a sheet of plywood I had in my garage, along with my daughter’s old five-foot toddler mattress, and put together a makeshift car sleeping setup, just in case things really went downhill… which they did. I went to bed in my house but woke up briefly Valentine’s night when the power went off, then went back to sleep until about 4 a.m. when it got so cold I couldn’t sleep anymore. Like many Austinites, I live in an older house that is not well insulated, and a quick check on the thermostat showed a shivery 56 degrees.
In my garage was my sanctuary, a fully charged Bolt with enough juice to heat the vehicle for six nights. I turned on the power button, set the car thermostat to 68 degrees, and slept surprisingly well on my five-foot mattress, my six-foot frame extended with my feet resting between the front seats on the hand rest. This was not how I would want to spend most nights, but comfortable enough that I decided to skip the rolling blackouts in my house the next night and just go straight to bed in the Bolt. By the third night, the power became more reliable, and I was finally able to go back to my real bed. I’m sure there were many Austinites who slept in their cars during this ordeal, but my electric vehicle allowed me to close my garage door to keep the wind out and not worry about carbon monoxide poisoning. Thanks Chevy!
The Austin region endured a boil water notice for over a million citizens for seven days. (8) Across the state, 14.9 million Texans were without safe drinking water and an untold number had no water at all. (9) The sad joke on us of course was that one cannot boil water one does not have with electricity one does not have.
Andy and Julia told me:
We were without power for 59 hours, during which our house temperature dropped as low as 39 degrees. We were fortunate to have camping equipment and a working gas stove and kept warm by drinking hot beverages and huddling in sleeping bags and under blankets during the daytime on the sofa and at night with the dog between us. We buried the cat in down jackets and she managed okay. We boiled a pot of water all day on the stove, balancing the moist heat it provided with the potential danger of carbon monoxide. We had to trust our battery-powered carbon monoxide alarm to be sure we weren’t overdoing it. I spent a lot of time checking on the dripping of exterior house faucets, and that of my absent neighbor. At one point, a water leak alarm alerted us to gushing water in our garage. Our water heater had frozen and burst its pipes and water was pouring onto the floor. Thankfully, there was no damage to any items.
In the aftermath of the storm, it took us about 10 days to find a plumber, and we were without hot water the entire time. Through the grace of a neighbor, we were able to get a few hot showers. The worst parts of the storm were not knowing how many days or weeks it would take for power to come back, as well as worrying about our older neighbors and how they were faring. We knew they were using their stove for warmth as well. Thankfully, our houses are old enough that they probably leaked enough air to prevent a gas buildup. Overall, we felt helpless and abused, knowing that decisions had been made to keep commercial building lights and factories running while homeowners, especially in the poorer outlying areas of town, shivered in the dark. Then we felt stabbed in the back when our governor lied and blamed windmills for the problem caused by corner-cutting and lack of weatherization at gas and other power plants across the state. We don’t trust our state’s leadership to have the will to force the fossil fuel industry to prevent this from happening again.
These stories are everywhere. Very few of my friends and colleagues had no problems. The climate change connection is definitive, astonishing, and is certain to become not just worse, but much worse even with no additional warming. We constantly hear in the media that scientists cannot tell if these repeatedly unprecedented events are because of climate change or not. While a valid statement, the concept radically misleads us civilians. You and I can tell. Scientists have been telling us for 30 years if we did not act this would happen. Why then do they say they can’t tell?
The reason they can’t tell is that statistics cannot robustly describe changing data. This is called the nonstationarity problem. Statistics only work with “normal” or stable data. (10) Because our climate is warming rapidly and in an unstable way, it is not normal, so the statistics have a high degree of uncertainty. This is why the climate scientists tell us they are uncertain.
More time is needed for more events to occur, so the statistics can become more certain. Thirty years is the traditional amount of time it takes weather patterns to become robust in statistical analysis.
But truthfully, and meaningfully, we can tell. “We…” Us civilians. It’s obvious. In our old climate, we didn’t have back to back to back repeatedly unprecedented extreme weather catastrophes like have been happening across the world with increasing frequency since the turn of the century; since the time when we warmed above the natural variation of our old climate. (11)
My wife waited 36 hours for a critical care bed, in toxic septic shock at our satellite hospital on the edge of Austin, her entire body failing because of the septic infection, with severe pneumonia, kidney failure, and worse. She waited for 36 hours because all critical care beds in the region were full, in all three of the Central Texas region’s hospital systems. Covid and the disaster were to blame. She was in the emergency room in Southwest Austin for 10 hours and waited another 26 hours upstairs in a normal room without water, with wildly dangerous blood pressure, her lungs full of fluid, her blood toxic.
Covid is absolutely a part of this climate change mess. We do not yet know exactly where and how the bat disease covid-19 originated or first was transmitted to humans, but the way it works is, habitat degradation and loss from increasing human population stresses animals and crowds them into ever smaller spaces increasing incidence of animal disease. The climate connection is that climate warming degrades and changes habitat, which stresses animals further, and changes their population density in different geographic regions, creating an even greater likelihood of animal disease. All this combines with animal migration from climate change, increased density of animals in smaller areas and closer human to animal contact because of habitat loss or changes, making animal-to-human disease transmission more likely. (12) We do not know exactly where or how Covid got into the human population, but climate scientists have warmed this day would come at some point in the future if we did not manage our climate pollution properly.
Another “distant future” thing climate scientists have warned us would happen if we delayed action on climate pollution is climate tipping. More than half of known tipping systems are now active. These tipping systems also describe our collapsing Earth systems, and once the tipping threshold is passed, tipping activation completes with no further warming with possible irreversible results. The tipping threshold was not supposed to be crossed for at least another 100 years when warming exceeded five degrees C (nine degrees F) above normal, where we are at about 1.0 degrees C (1.8 degrees F) warming above normal today. Forty-five percent of tipping systems have dynamic feedback links to other tipping systems where tipping in one system hastens tipping in others. These tipping systems include: Arctic sea ice, Greenland ice sheet, boreal forests, permafrost, the Gulf Stream, the Amazon, coral, and the Antarctic Ice Sheet. (13)
The unavoidable conclusion to irreversible climate tipping is that it has the capacity of, “potentially making large parts of Earth uninhabitable,” according to nearly 14,000 scientists in “World Scientists’ Warning of a Climate Emergency,” published in the journal Bioscience in November 2019. (14)
Bombogenesis (what causes a bomb cyclone) in the North Pacific started this string of cascading climate change feedbacks that all too likely collapsed the polar vortex. Climate change warmed arctic air, still bitterly cold, was then shunted far south from its normal path, aided by collapsing Arctic sea ice 50 years ahead of projections, putting far more energy into the polar environment from open water than from our once stable climate with far more sea ice. (15) The resulting collapsing polar vortex then stalled the jet stream, another climate change-related event caused by arctic amplification, where the Arctic warms faster than the rest of the world causing jet stream loops to grow larger and slowing their west-to-east progression. (16) The event was so extreme the polar vortex spilled into the western Gulf of Mexico, sending record low temperatures as far south as Brownsville.
Here is a story from a buddy’s ex, Anne:
My experience here in Austin with the freeze was not extraordinary. In fact, for three days I congratulated myself on choosing a home that was on the same circuit as a hospital. My house only lost power for one afternoon, and my 13 year old daughter and I didn’t have to suffer a night with no heat. We collected firewood and learned to use the gas fire starter in our fireplace that I had never used before, but the fires in our fireplace were more for ambiance than necessity. Then one morning we turned on our faucets and nothing came out. Nothing came out for five days, and we collected snow in buckets to use to wash dishes and flush our toilets. We were so very grateful when we found out that the city was handing out cases of bottled water at a location near us, and there was an efficient drive up system where volunteers would bring the water to your car. I drove home with my case of water thinking how lucky I am to live in a city that takes care of its residents.

Then as it so often does when you are least prepared, reality slapped me hard across the face. In an effort to give back to the community (or maybe just to feel good about myself) I volunteer with Meals on Wheels. Three days after the storm I had a delivery route. I did my regular drop offs and told the seniors to ‘take care.’ Then I arrived at the fourth house on my list… the rear unit of a two unit property in East Austin. A dull ache in the pit of my stomach greeted me as I walked up to the door. There was black fabric draped around the door. I knocked, but my gut told me immediately the significance of that black shroud. Of course, there was no answer. I walked up to the front unit and knocked on the door. I told the woman who answered the name of the gentleman who was on my list and told her I had his meals. She looked at me with great sadness and said, ‘He passed on Thursday.’ I just said ‘I’m so sorry. Thank you for letting me know.”’Shaken, I carried my bags of food back to the car. I sat staring out of the window of my car unable to move. I started sobbing for this man that I didn’t know; this elderly man who may or may not have had family and who most likely died alone… alone in a freezing house. My grief turned to anger. How can this happen in the richest country in the world?
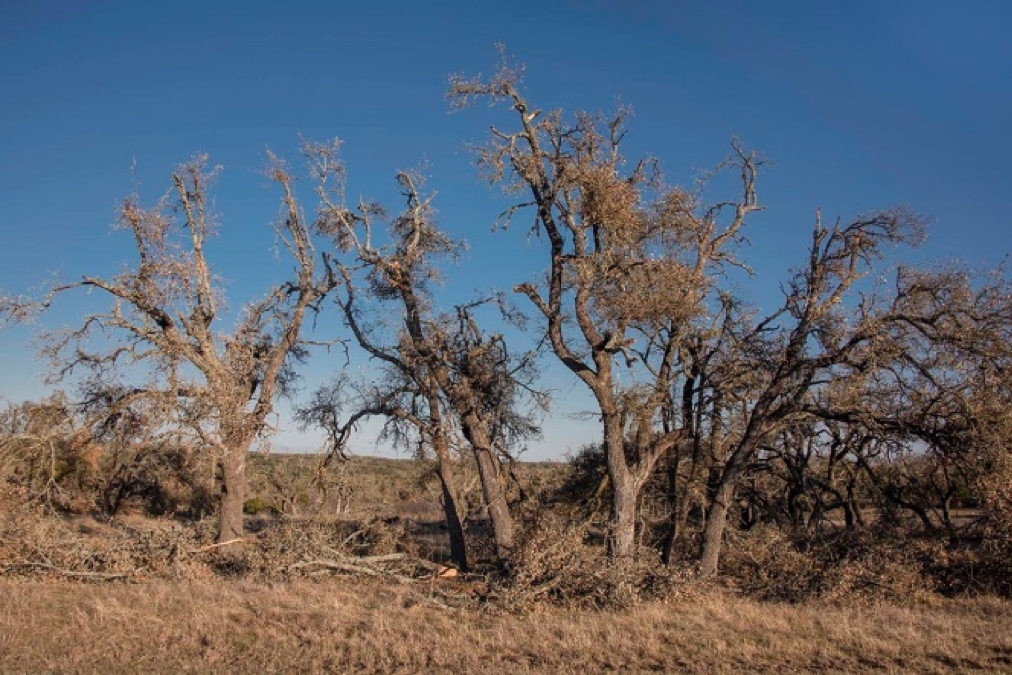
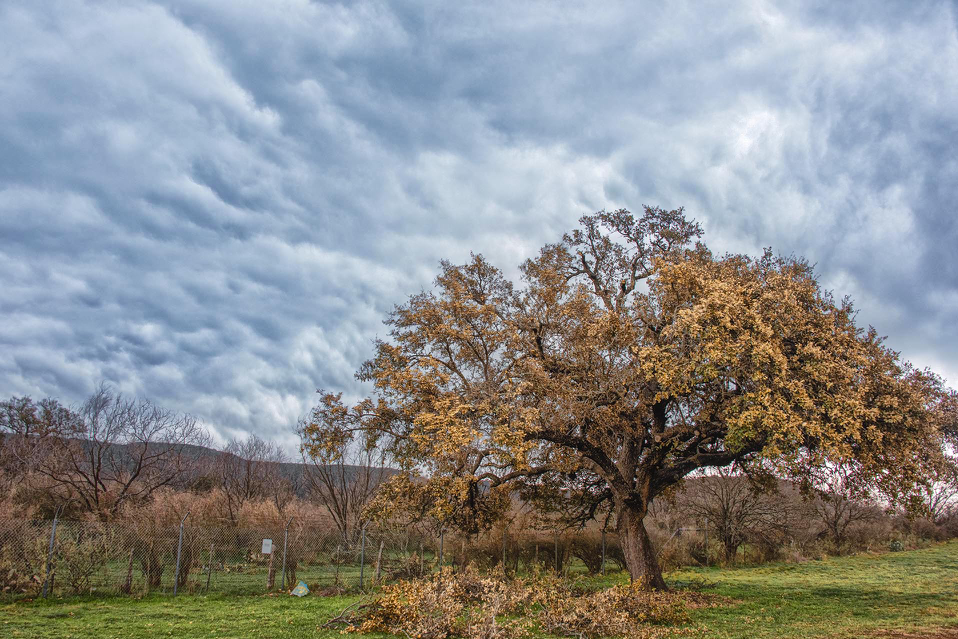
One of our very favorite trees was hit hard by the ice. It is a desert willow with those beautiful mauve and yellow orchid-like flowers. The entire top of the tree was hanging down, its three main limbs busted off about twelve feet high. My family lives on a culdesac adjacent a park, and one of the park goers stopped his truck in the middle of the street to see how I was doing. I was on a ladder in the street with loppers, attempting to disentangle a wonderful native grape vine that had provided us with jelly for years. I climbed down to talk and as my neighbor didn’t speak English too well I enjoyed trying to have a short conversation with him in Spanglish. It was March 14, one month after the great blizzard. This gentleman’s pipes had burst in the storm and he was still without water. He had a plumber lined up in six weeks and was hauling water to cook, bathe, and flush, but he stopped to ask how I was doing.
One of my daughter’s friends has helped over 210 people get their vaccinations. It’s not just about the storm. It’s about cascading feedbacks and simultaneous disasters climate scientists have warned us would happen if we delayed action. The extended winter storm caused power outages that caused our water infrastructure failure and storm-related injuries and complications to fill the few hospital beds that weren’t occupied by the ongoing simultaneous covid pandemic. And this was just the beginning. Scientists have been worried about these cascading feedbacks and simultaneous disaster and now they have arrived. (17)
My wife was in the hospital nine days. The dentist says my face and teeth are not cracked, but I still may lose some teeth. Daughter made it over to our house in her two-wheel drive later that day through the unplowed snow that lay deeper on Central Texas roads than it ever has before. She only became stuck three times.
How many of us know someone who died in the hospital alone during covid? How many of those people even had covid? My wife and I were fortunate that Austin hospitals were not in total covid lockdown during the disaster. One person per day was allowed visiting rights.
My friends Craig and Jaynee’s experience:
The temperature started dropping on the weekend — by Sunday, February 15th, we had snow. I have a greenhouse filled with rare plants, so I retrieved the propane heater from the garage just in case, and me and my wife went to bed. When we woke up Monday morning, the house was completely silent and colder than normal. I realized then we had a power outage. The greenhouse was right around freezing, so my first job was to light the propane emergency heater. Gas and water still worked – everything else was off line. The power stayed off for four and a half days. On Tuesday morning, February 16th, the water pressure fell drastically, and a boil water notice was issued. On Friday afternoon, the power came on again, and a day or two later, water pressure became normal. Because I had invested in energy-saving improvements to my home to take advantage of rebates, even though the outdoor temperature stayed below freezing for most of that time (with a low of eight degrees F on Monday night), our house never got below 55 degrees. Some of our neighbors had house temperatures that dropped into the 30s, with frozen pipes that flooded portions of their homes. A few neighbors even had to move out temporarily.
I have a good four-wheel drive vehicle which enabled me to drive around in the icy conditions and help some of my friends who needed assistance. More recently, when I heard Governor Abbott and other elected Texas officials lie about the causes of the catastrophe, and have since watched the Texas Lege refuse to deal with the real causes of the problem, I have no confidence in the ability of our state government to protect us. Climate change is real, is happening now, and if we don’t change what we are doing quickly, even more people will die. We have to protect Texas citizens ahead of the corporate profits of the fossil fuel industry, or give up the fiction that we are a democracy, and bow down to the will and the money of our corporate overlords. That’s not the Texas I remember.
Ascension Seton Medical Center amputated 11 feet because of frostbite. (18) Five people had both feet amputated and this was at just one of the three major hospital systems in Central Texas where frostbite is almost completely unheard of. Remember, not only is this Texas, but it’s Austin. We are the same latitude as New Orleans and Jacksonville, Florida.
This is the story Bob tells me:
Sunday night, falling asleep with beautiful, rare snow falling outside, everything went dark and silent. Lights went off. Heating fans shut down. My bi-pap machine stopped working. My thought was, ‘Interesting. Power off for a few hours.’ We positioned candles and matches. I dressed in heavy sweats, piled three blankets on, and slept well. It was strange the next day. Under blankets in the middle of the day, blocked from usual activities — computer, phone (battery dead), TV, music. Another night and more layers of warm clothes and blankets and quilts. The next morning, 40 degrees inside. Ice on sidewalk and driveway made car access dangerous. What if it kept getting colder? What if I lived in an apartment like the one I had in Corpus Christi which would have been below freezing that first night? What if I had health problems and needed emergency help with a dead phone? Finally, around 1 p.m., the power came on for four hours. We heated the house, ate hot food, and charged all the electronics. Even though we lost power for another 30 hours we did fine, unlike too many less fortunate than us, but those ‘what if’’s’ still nagged me.
And a special note from Bob’s wife Victoria,
As a psychotherapist working comfortably from home during the COVID year, I was excited when I heard we were expecting a real winter storm with serious snow. I have never lived north, and saw a snow storm as half adventure, half vacation, until it came. In the beginning, my husband and I were all bundled up inside, watching the snow fall, but without charged phones or internet. That peaceful interlude ended when our connection to the outside world was restored. I began to receive frantic phone calls from clients who had run out of food, truly afraid of starving, running out of medication they needed to sleep and fight anxiety. Several survivors of severe childhood neglect suffered paralyzing flashbacks and nightmares. People for whom I have come to care deeply were suffering real danger and trauma, and all I could do was abide, as a hopefully calming voice on the phone. I could only hope that was enough. Along with the snow, bitter cold, treacherous ice and power and water beyond my imagination, Winter Storm Uri brought terror and thoughts of mortality and suicide to vulnerable Texans.
Just how bad is Climate Change?
This was definitively a climate change-caused event, let’s make this clear. For nearly 30 years we have been told these types of repeatedly unprecedented events would happen sooner rather than later if we did not act to responsibly deal with our emissions of excess climate pollutants. We did not deal with those pollutants and now increasingly extreme unprecedented events are recurring over and over again.
This story is from another friend also named Bob, this one a local meteorologist:
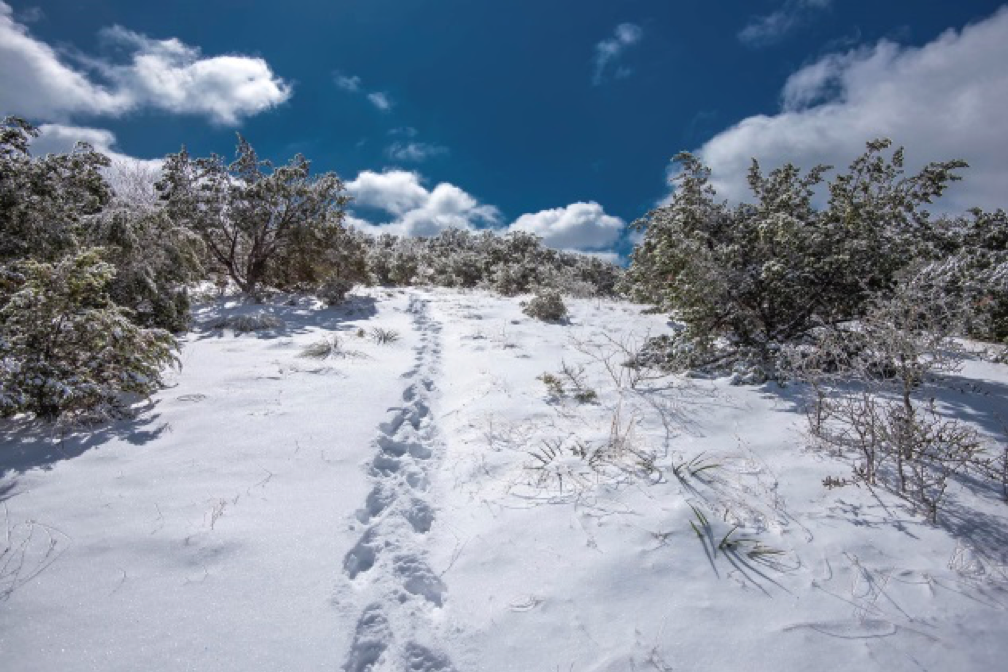
I’ve lived in Austin for 33 years and I have to say the snow and record cold event in February 2021 was the most unique weather event I have witnessed in all of those years. The sight of seven inches of snow covering everything in a blanket of white for five days, making the landscape look more like New England than Texas was unbelievable! Nothing escaped Mother Nature’s blast that came straight out of the North Pole. It wasn’t just the bone-chilling cold, it was the phenomenal snow and ice that didn’t want to go away, combined with fierce winds. It’s still hard to comprehend the magnitude of February’s cold air and snow that was so unique in the historical climate records of Central Texas.
My friend who wrote the story above suffered a broken water pipe and lost his floors. Throughout this event the moments of tragedy and despair were punctuated by surreal experiences of joy and wonderment at the beauty and awesome power of Mother Nature. Because this event was so wildly unprecedented, many if not most of us in Central Texas had never before seen such a display of what would be considered “normal weather” in other parts of the world.
These wildly unprecedented extreme events however, have a dark side that very few in science and even fewer elsewhere have acknowledged. These repeatedly unprecedented events are likely common in our currently warmed climate. The reason they are likely common is simple; not enough time has elapsed since our climate has changed for rare and overly extreme weather events to occur.
The date we warmed beyond our old climate’s natural variability is called the time of anthropogenic emergence. (19) This “natural variability” is the normal range of the average temperature of our old climate. The threshold was crossed about the year 2000 when we warmed above 0.5 degrees C above what was normal about 150 years ago, before the fossil fuel era began.
Most of the time since anthropogenic emergence, warming above normal has only been slight. But because climate warming is accelerating, meaning more warming has happened recently rather than earlier, this means that it has only been five or 10 years since our climate has significantly warmed above natural variation. This is a rather short amount of time, on average, for a rare and overly extreme event to occur like the 100-year storm. (20)
This warming beyond the “natural variability” of our old climate is really important in another sense too. Tenth grade biology tells us that when a system’s evolutionary boundary conditions change, that system must re-evolve. In other words, when the boundary conditions like temperature or precipitation change beyond normal, the system becomes hostile to its existing species. This means their existence is at first degraded, then they die, or they must migrate to survive. The entire system is then forced to re-evolve with new species that can exist in the new boundary conditions that were hostile to the old species. (21)
The importance of evolutionary boundaries
We have now changed our world beyond the evolutionary boundary conditions of our Earth systems. These are the systems we depend upon for our survival that allowed humankind’s advanced civilization to develop. They have now passed a threshold and are in active tipping to irreversible scenarios. These scenarios are what are important. If our collapsing Earth systems complete their activation periods they become irreversible with unrecoverable scenarios. These are the dystopian scenarios we have been warned would happen if we did not responsibly address climate pollution. Because of delay in action, these scenarios are now active, 100 years ahead of schedule. (See Reference 13)
The concept of environmental services being pivotal to the survival of our advanced society is the new focus of the climate change emergency. These services include things we get from agriculture, or from engineered systems where we design so many aspects of our lives using our old climate boundary conditions like flooding, wind loading, sea level elevation, and fire behavior. The extremeness of these things increases nonlinearly with warming. This means that a little warming does not increase weather response a little, it increases it a lot. (22)
Agriculture services areas are easier to visualize. If it gets too hot, dry, or wet, our food supply is at best degraded. Our civilization has been designed to grow food where droughts are rare, to survive flooding from lower rainfall rates in our old climate, to build our homes to keep us safe, and to create industrial processes at the very edge of the sea where cheap massive transportation is readily available. Change Earth’s boundary conditions and radical results can occur like the 1-million year storm that the Capitol Weather Gang identified as Hurricane Harvey’s 60 inches of rainfall (23); like the 37 percent more heat-related deaths from climate change across the globe every year (24); like the wildly unprecedented firestorm that destroyed 14,000 homes in Paradise California in six hours (25); like the astonishingly radical and ongoing collapse of permafrost where 1.2 billion acres is at risk with emissions of 2.3 gigatons as carbon dioxide on average from 2003 to 2017. (26) Because the emissions from this permafrost collapse is an average over 14 years, and because permafrost was likely not collapsing in 2003, it is very likely then that the quantity of emissions from collapsing permafrost is much greater than 2.3 gigatons per year and possibly rivals the seven gigatons of annual emissions from all of transportation across the globe. (27)
We have engineered our world with a stable sea level where much of Earth’s wealth and industrial capacity is in the near shore zone. We depend on the stability of the range of extreme events in our old climate to allow engineers to safely design things using known storm surge heights, or known ranges of water temperature for industrial and power generation cooling.
The National Oceanic and Atmospheric Administration (NOAA) has reported a 38 millimeter (1.5 inch) jump in sea level in 2019 from the average of all NOAA tide gauges in the lower 48, where the long term global average sea level rise is 3.5 mm per year. (28) A stable sea level is mandatory to serve coastal infrastructure systems that cannot rise with the rising seas.
Our beaches and dunes protect our barrier islands, and our barrier islands protect the mainland. Just a little sea level rise erodes and disintegrates barrier islands and compromises (destroys) engineered systems that rely upon a stable sea level. The beach and wetlands disintegration threshold is 5 to 7 mm sea level rise per year. (29) Three feet of sea level rise per year is the adaptable limits of our civilization. (30) Unadaptability means, three feet of sea level rise causes unrecoverable economic collapse. It’s not the direct impacts that will take us out, it’s the costs that matter.
Antarctic Ice Sheet collapse is 100 years ahead of schedule. (31) Permafrost collapse is 70 years ahead. (32) Hurricane intensity is 50 years ahead of projections. (33) Upper ocean stratification is six times faster than predicted. (34) Intense rainfall today is already triple the IPCC 2100 projection in Houston and double in Austin. (35)
Southwestern North America is 20 years into a megadrought that rivals the worst megadrought in the last 1,200 years. (36) The largest California fires ever have nearly quadrupled in size in the last four years and the latest 2020 burned area record is more than double the previous record from just 2018. (37) One fire in 2020, the 174,000 acres Sequoia Complex, killed up to 14 percent of the world’s known sequoias. (38) CalFire says these firestorms are burning 400 degrees hotter because of drier fuels. (39) Five of the six largest fires in California’s history happened in 2020 with the largest fire more than doubling the next largest, (40) and acreage totals now at pre-human civilization levels, (41) only in 2020 California spent $1.3 billion fighting fires, when in prehistory we spent zero. (42)
Forest area failing to regenerate after fire in the American West has doubled since 2000 and overall regeneration density has been reduced by half. (43) This increase in fire-burned area and extremeness may have been caused by excess fuels from Smokey Bear fire suppression policies in our past climate, but record dryness, record fire indices, increased ignition in warmer temperatures, and increased fire behavior are the driving causes of increased fire today in our warmer climate. (44) The climate change connection is simply overwhelming with total numbers of fires falling by nearly 50 percent in the last 30 years. It’s the size and intensity of fires that is new, caused by climate change and not Smokey Bear. (45)
Drought is now so widespread, persistent and so severe that a new type has been defined, “ecological drought,” where existing ecosystems are collapsing because their species cannot survive the hostile new environmental boundary conditions. (46)
Most important of all environmental services, Earth systems capture and store excess greenhouse gases as a normal part of our carbon cycle we depend on to keep our climate in balance with Earth systems. As these systems warm further and further from their evolutionary boundaries, they stop absorbing greenhouse gases and begin to emit them in a climate change-caused collapse cascade, compounding the warming caused by humankind’s excess emissions.
Collapse of the Amazon is more than 100 years ahead of schedule and has already flipped from carbon sink to carbon source three times since 2005, (47) with a permanent flip now projected by 2035. (48)
It’s not just the feedbacks and tipping, it’s these wild and repeatedly unprecedented extremes too. Because it is likely the extremes we have already experienced are common in our currently warmed climate, because not enough time has elapsed for rare and overly extreme events to occur, even if we halted all increasing warming this minute, the rare and more extreme events would still occur as more time elapses for a rare events to occur. (49)
A friend in San Marcos recorded 31 degrees in their bathroom but thankfully the toilet didn’t freeze. Another friend in a 100 year old house just south of San Marcos reported 19 degrees inside their house and thankfully they had drained their pipes. A friend in Houston lucked out and didn’t lose power for more than two days total and had no damage, but every single house on all sides had burst pipes.
The story that may have affected me the most, I mean beyond my wife’s brush with death and nine days in the hospital, and beyond me hitting myself in the face with a suburban, one of my engineering colleagues, a senior professional engineer like me; he died of hypothermia. My gosh, an engineer like me.
Starkly, like a slap in the face, when we bundle all of these things together, what we have is a clear and simple story of why this disaster we endured in Austin happened because of climate change, and also why most of the rest of these repeatedly unprecedented extremes we have been enduring lately are caused by climate change too. It’s also why we can expect much more extreme events even if we magically halted all warming tomorrow. And, it’s why far, far more extreme events will occur if we allow warming to continue to the currently accepted maximum warming target of 1.5 degrees C above normal.
We have warmed Earth beyond the evolutionary boundaries of its systems. These systems have passed through thresholds and have begun to collapse or tip, and these collapses will complete with irreversible consequences if we do not cool Earth to below their tipping points that is cooler than our 1.0 C warming today. What is required then is for climate policy to take a giant step forward. After all, 30 years ago climate scientists warned us our challenge would become far more complicated if we delayed action on climate pollution reform.
It is time to accept that delay has now created a world where the warming limit is much cooler than previously anticipated. That quote from nearly 14,000 climate scientists about tipping “potentially making large parts of Earth uninhabitable,” is no longer just idle worst-case thought. Because of delay, existential impacts have now begun that will not reverse unless we cool Earth, not allow it to continue to warm.
There remains hope
We can restore our climate, but we cannot do it with emissions reductions alone because emissions reductions only reduce the amount of future warming. Therefore, net zero emissions reductions and simultaneously, very large atmospheric removal of carbon dioxide are both required, and both are considered to be compulsory and complementary. (50)
Think of this concept as: how deep would it be if our engineers had not developed human sewage treatment. We have been dumping climate pollution into our sky for centuries, and now it’s getting deep.
There are nearly 2,500 net zero plans globally. (51) However, net zero future emissions alone allows warming of more than 2.0 degrees C because of warming in the pipeline. This extra warming is simply further warming to come because our cool oceans and ice sheets have been air conditioning the planet. Think of this concept as if we air conditioned our houses with ice. After a while, the ice melts and it gets really hot. (52)
Though many net zero plans also include a 1.5 degree C warming limit that requires carbon dioxide to be removed from the atmosphere, 1.5 C is too warm too.
Climate scientists said the challenge would become more difficult with delay, and now we find ourselves in a world that has warmed so much that the science has changed. We must now remove much of the already emitted climate pollution from our sky to be able to restore these irreversible tipping systems to their former stable states before they complete their unrecoverable initiations.
Think of this concept as if it were a pot of water on a stove. With increasing warming today, this is like we are continuing to turn the heart up on the pot. If we stop turning the heat up and leave the burner alone, the water still boils.
So the challenge is to cool Earth to less than our current warming today of about 1.0 degree C above normal, preferably to within the boundaries of natural variation or evolutionary boundaries of our old climate that maxed out at about 0.5 degrees C warming above normal.
We actually do know how to remove by far the most meaningful of greenhouse gas pollutants from our sky, carbon dioxide. The popular press thinks carbon dioxide removal technology is yet to be invented. It is not. This is an artifact of the scientific process. Scientists are not yet certain exactly how we are going to scale existing technologies to meet the giga demand of atmospheric removal, where we literally need to remove hundreds of billions of tons of CO2 from our sky. They do not know because we haven’t done it yet, they are therefore uncertain. Sound familiar?
When President Kennedy said we would go to the moon in 10 years in 1962, we hadn’t done that yet either and naysayers had a field day. But the tech was there, it just needed to be gigasized and if it’s one thing our engineers can do today, it’s gigasize. We have been removing CO2 from air for about a hundred years. The tech exists, we just need to gigasize it.
There is another bit of reporting and belief that needs to be discussed here that says, “Mother Nature can fix climate change through her natural systems if we just give her the chance by enhancing and restoring those systems, like our degraded farmland, oceans and forests.” Some of the CO2 removal we need can most certainly be done with nature-based systems that have not yet begun their collapse, but their rates of removal are slow and their quantities are limited.
Plausibly we can achieve up to about 10 gigatons of CO2 removal per year globally with nature-based solutions but feasibly, considering things like only planting forests where forests are likely to grow, the number goes down to about 5 gigatons per year. When equity and sustainability are considered, in as much as we can’t plant forests on poor people’s subsistence farming land and things like that, the quantity according to the National Academy of Sciences is about 2.75 gigatons of global CO2 removal per year. (53)
Because emissions reductions do not remove atmospheric CO2 that is causing our current warming that is responsible for the climate tipping and all the extreme mayhem, and because nature-based solutions cannot achieve the amount of atmospheric removal needed in time frames that matter, we must now turn to pollution treatment strategies like we use to treat human sewage, or really, almost any other pollutant. After all, we know what to do with pollutants. We treat them responsibly and remove them from our environment so we can be safe.
Restoring our climate to within its former evolutionary boundaries
The climate pollution treatment infrastructure needed to deal with accumulated carbon dioxide in our sky will be similar to that we began creating when we discovered human sewage was killing millions in the 19th century, and importantly, we did not stop creating human sewage with this great revelation, we simply treated that pollution responsibly.
Greenhouse gas removal strategies are admittedly different from human sewage treatment, but similar in simplicity. The two main processes were developed in the early 20th century: the recyclable lime-potash process and the amine process. Human sewage treatment is mostly done today with a biologic reactor. The recyclable lime-potash process was developed in the first decade of the 1900s and one of its most important early uses was keeping our sailors safe from carbon dioxide poisoning in submarines in World War II.
The other process uses amines, a group of ammonia-based chemicals that are plausibly one of the single most important chemical groups in all of industry. Amines were first developed in the 1930s.
We have emitted 2,386 gigatons of carbon dioxide from fossil fuels, cement, agriculture, forests and land use changes since 1750, and about half of these emissions remain in our sky. (54) This is vastly more in quantity than the 40 gigatons of annual CO2 emissions we must deal with to create net zero emissions. We now have no choice but to gigascale these carbon dioxide removal strategies like we have gigascaled the treatment of human sewage, and batteries, transistors, solar cells, toilet paper, automobiles, electricity generation and transmission, our public schools, gas stations, fast food, our medical industry… our fossil fuel industry… We make 24 billion pairs of shoes globally every year. (55) It’s a gigalist of things our civilization has gigascaled; we treat 116 gigatons of water and wastewater across the planet every year. (56) We mine 54 gigatons of aggregates every year and we treat or otherwise deal with about 200 gigatons of mining waste every year. (57)
Since 2011, costs for removing carbon dioxide from the sky have fallen from as much as $600 to $1,000 per ton to $100 per ton. In total, these costs will be far less than what we spend on many things every day, including an additional 10 or 15 percent more to store it away safely or make something useful out of it like synthetic limestone to replace some of those 53 gigatons of aggregates we use across the world every year. This $100 per ton number though, is just the beginning. We are just getting started. (58)
David Keith of Harvard’s Kennedy School, chief engineer at Carbon Engineering in Squamish British Columbia, has published a transparent account of their CO2 air capture process that is not common in industry where trade secrets can be worth billions.
Kieth’s $100 per ton recyclable lime-potash CO2 removal cost is based on scaling Carbon Engineering’s 1,000-ton-per-year pilot facility to 1 million tons per year using existing tech, off the shelf components, and known scaling factors. (59) This is the beauty of the recyclable potash/lime process — it is a mature process with industrial scale equipment already in existence and known scaling factors. Carbon Engineering funders include Bill Gates, Murray Edwards, BHP, Chevron, and in the Permian Basin they are partnering with Occidental Chemicals to build a 1 million ton per year facility. (60)
Their current pilot project uses natural gas energy with a 10 percent carbon penalty with energy costs at $0.03 to $0.06 per kilowatt hour (kWh), and 8 percent profit.
Because energy demands are about 87 percent of the recyclable lime-potash process, and because wind and solar energy have now dropped to $0.01 per kWh or less, and Keith’s process is 87 percent energy related, Keith’s $94 per ton at $0.03 kWh current energy costs falls to $31 per ton. Reduce this by 10 percent for the carbon penalty with the current process using natural gas, by 10% for capitol recovery and 8% for profit because removal for the commons has no profit need and the costs drops to the range of $20 per ton. (61)
Next, gigascaling the carbon removal infrastructure will be doing things like so many industries worldwide and costs will plummet further. During the oil embargo in 1976 when Jimmy Carter was President, solar photovoltaic cells were $76 per watt. In 2020 because of gigascaling, their cost had fallen to $0.21 per watt. The cost in 1976 was 35,000 percent more than it is today.
To safely store away the carbon dioxide the costs are in the $5 to $10 per ton range with vast quantities far in excess of storage needs available in underground oil plays, saline aquifers, and basalt formations. There is no reason the costs of storage will not fall in a similar manner to the costs of removal.
Of great detriment to our future, underground storage has been wrongly associated with fracking, earthquakes, and leakage where academic findings on actual leakage are very, very small — after all, nature has been storing high pressure natural gas underground for millions of years.
The reality is that in basalt (ultramafic) rocks, after a year or two underground injected CO2 is rapidly assimilated into the geologic strata through mineralization where it turns into rock. Leakage is very small and most is absorbed into deep and toxic saline aquifers where the CO2 literally sinks to the bottom of the aquifer, and by permanent storage absorption by kerogens, the component of oil shale that fracking and chemicals addresses to strip out oil and gas. Costs range from $0.50 to $100 per ton, in existing industry or theoretical modeling, not gigascaled. Permanence is 2 percent leakage in 10,000 years, or 2,000 tons per year for each 1 billion tons stored. Storage in the U.S. continental shelf ranges from $5 per ton for 2,500 gigatons, to $10 per ton for another 5,000 gigatons. (62)
Another misrepresented piece of the underground CO2 storage puzzle is enhanced oil recovery or EOR. It is widely believed that burning all the recovered oil that comes from EOR creates far more climate pollution than the captured CO2 used to enhance the recovery. This is a dangerous misrepresentation of the science.
The academic work on the net carbon storage with EOR is based on how much CO2 remains in the ground when CO2 recovered with oil and gas is vented to the atmosphere or recycled to the next well. What this body of research is saying so far is that net carbon sequestration may or may not be slightly negative or positive — but this is based again, on recovering all the free CO2 in the well so that it can be recycled to the next well for further enhanced oil recovery. Current non-industry reporting tells us about half the CO2 injected returns to the surface with recovered product. The bottom line is that EOR can be made virtually as carbon negative as one wants by simply closing the valve to the well before all the CO2 comes back out of the ground to be recycled to the next well. (63)
Now that we understand that treating climate pollution is not so different from any other pollution management, the costs seem to be so gigantic that we could never afford it. First of all, if we do not “afford it” somehow, large parts of Earth become uninhabitable. Therefore we either afford it or perish, and the risks are not just from the hostilities of an irreversibly collapsed climate, they are also through economic collapse as we advance to the state of an irreversibly hostile climate.
But this “do it or die” concept is just the nuclear alternative. The concept remains that costs to treat climate pollution are not so different than many other things we do on Earth today; this is a real and valid concept.
What does responsible climate pollution treatment cost?
Total costs to restore Earth’s temperature to the point where tipping is no longer active, at David Keith’s $100-per-ton carbon dioxide removal for 1,200 gigatons CO2 to ensure we get our temperature restored back to within the evolutionary range of our Earth systems is by simple math $120 trillion, plus 10 or 15 percent more for the cost of building the infrastructure and safely disposing of or utilizing the captured CO2. We need to complete this removal in a decade or two so we can have time for our oceans to cool before polar ice collapse goes irreversible. The annual economic burden, at costs today, is about $6 to $12 trillion a year globally for 10 to 20 years. Because the U.S. is responsible for about a quarter of all global emissions since 1750, our share is $1.5 to $3 trillion annually and remember, this is what it costs today; long, long before gigascaling. (64)
Gigascaled with site-built utility-scale carbon free energy, costs are 90 percent lower, or $12 trillion to remove 1,200 gigatons CO2 globally, or $130 to $300 billion annually for 10 to 20 years in the U.S.
To get an idea of what we can “afford” if the stakes are high enough, if we are motivated to save our skins, we spent $19 trillion (2019 U.S. dollars) in WWII in seven years, or 43 percent of global GDP, mostly on industrialization. If we were to spend 43 percent of global GDP on climate today, that would be $37 trillion per year. (65)
We spend $214 billion per year on the Clean Water Act in the U.S., much of which is related to treating water and wastewater to ensure the safety of our drinking water supply. We spend $500 billion per year globally ensuring safe drinking water. (66)
We spent $494 billion on advertising and marketing in the U.S. alone in 2020; $1.28 billion globally. The costs of being sick at work every year in the U.S. are $576 billion. We spend $479 billion on entertainment in the U.S. every year, and $1.7 trillion globally. U.S. citizens pay $1.7 trillion for their energy every year and $1.1 trillion on transportation annually. Life insurance premiums globally are $2.6 trillion. We spent $3.8 trillion in the U.S. on health care in 2019. (67)
The reality is that gigascaling makes costs almost inconsequential, and we have gigascaled this planet of ours in almost every way. We spend amounts similar to what we must spend to restore our climate routinely, without thought, and now we can understand that climate pollution is just one more gigascaling demand that we have a responsibility to address in similar ways that we address our other responsibilities.
We need to switch our energy source from dirty and dangerous fossil fuels too, so that sustainability issues other than climate pollution do not end civilization as we know it. And we need to deal with our sustainability issues with forests, agriculture, and our oceans as well, not just because they are huge emitters of climate pollution, but because these resources also have the capacity to kill us all if they collapse from other irresponsible uses.
The critical path
Everything in this beautiful world of ours is connected, but there is a critical path. This critical path is to address our current warming caused by current greenhouse gas concentrations in our atmosphere, mostly carbon dioxide. If we do not follow the critical path, we lose. So what can we do as individuals?
To start with, we can do what we have been trying to do for 30 years with fossil fuels. In this case, we literally already know what to do. Reuse, recycle, become more efficient, resource, replenish, restore; we have been taught these things for generations. They all have implications for climate pollution; in effect, decarbonize.
We need foremost, however, to support strategies that gigascale carbon capture. These strategies range from fee and dividend to Environmental Protection Administration pollution regulations, to local and regional collaborations.
We need to ensure we can return our world to its former climate boundary conditions by mid-century in the case another climate science denier is elected to U.S. national leadership and we can do this by acting at the local and regional level through collaborations in carbon capture, utilization, and storage. After all, we all did this to ourselves and it is our responsibility to clean up the gigamess. Further delay means curtains for life as we know it.
But first we have to be motivated. This is a climate emergency as the folks in Texas, or California, or the Gulf Coast, or pick a place with a recent climate catastrophe, we all can say; yes, it is a climate emergency.

What is a climate emergency?
A climate emergency is upon us. Dystopian climate tipping impacts have been warned of for 30 years if we did not act to responsibly manage our climate pollution. They were only supposed to happen in the distant future, but have now been activated 100 years ahead of widespread projections because of our delay in action. The emergency has been caused by warming already experienced, by climate pollution already in our sky, and it will become irreversible with unrecoverable human culture scenarios — with no further warming. Our response must definitively not be just about making decarbonization more aggressive or implementing net-zero in a broader and more meaningful way, because these actions only affect future warming.
A climate emergency response is about acting immediately with a classic emergency response used in any other emergency, with the tools at hand, to save countless lives, by dramatically and rapidly lowering Earth’s current temperature, so as to reverse unrecoverable tipping collapse activated now, when they were not supposed to activate until 5 degrees C warming, so we can prevent large parts of Earth from becoming uninhabitable in our lifetimes. Emergency actions that urgently accelerate historic climate culture timelines, must be completed before tipping collapses become irreversible. We were warned this would happen if we delayed too long and now it has begun. There is no safe amount of future warming any longer because active irreversible tipping completes unless we lower Earth’s temperature back to within the natural variation of our old climate; back to within the evolutionary boundaries of our Earth systems. Lowering existing atmospheric levels of greenhouse gases already accumulated in our sky and specifically CO2, must be prioritized with emergency wartime urgency. Our atmosphere and our oceans must be cooled back to within our climate’s historic boundary conditions by mid-century at the latest. This emergency will not abate until Earth’s temperature is lowered back into the boundaries where our Earth systems evolved.
One other thing about responsible climate pollution management that we have to get right the first time is equity. Leading nations must equitably treat the rest of the world. We cannot demand they pay their fair share when systematic biases have created inequality. First, developed nations must be responsible for removing their historic emissions that remain in our sky, and for creating net-zero emissions. Second and most important, privileged nations must bear the cross of those less privileged. We must both remove their historic emission from our sky, and we must offset their future emissions until the time when they can do so for themselves.
All that remains as my brother says, is to finish up. To do this, to increase motivation, use one of the best awareness creating tools available from the burgeoning field of global warming psychology — stories. Tell your friends. Tell your friends the stories. Tell them about why this icepocalypse, firemegeddon, floodsaster, or heat tsunami was caused by climate change, and why the answer to the question of the cause is definitively not, “the scientists can’t tell yet.”
Stories are one of the greatest motivating factors in psychology. They are about people like you and me. They are about us. We care about us.
REFERENCES
The Texice Disaster – Stories of Survival – REFERENCES
(1) At the peak of the storm, 69 percent of Texans, 20 million people, were without power… “More than two out of three (69%) Texans lost electrical power at some point between February 14-20, for an average of 42 hours, during which they were without power on average for one single consecutive bloc of 31 hours, rather than for short rotating periods.”
The Winter Storm of 2021, Hobby School of Public Affairs, University of Houston
https://uh.edu/hobby/winter2021/storm.pdf
(2) Up to 978 people died in the Texas Ice Disaster in 2021… Buzzfeed conducted an excess deaths analysis for the ice disaster where they compared previous years’ total deaths to those during the disaster, with illness such as cardiovascular disease and diabetes. They found between 426 and 978 more people than expected died in Texas in the week ending February 20 alone. This work was reviewed by individuals at University of California at Berkeley, Virginia Commonwealth University, and University of Jerusalem.
Popular press article –
Aldhous et al., The Graveyard Doesn’t Lie – The Texas Winter Storm And Power Outages Killed Hundreds More People Than The State Says, May 26, 2021.
https://www.buzzfeednews.com/article/peteraldhous/texas-winter-storm-power-outage-death-toll
Technical Analysis – https://buzzfeednews.github.io/2021-05-tx-winter-storm-deaths/
The disaster cost $200 to $295 billion… The Perryman Group is an economic research and analysis firm based in Waco, Texas, serving the needs of more than 2,500 clients, including two-thirds of the Global 25, over half of the Fortune 100, the 12 largest technology firms in the world, 10 US Cabinet Departments, the 9 largest firms in the US, the 6 largest energy companies operating in the US, and the 5 largest US banking institutions.
https://www.perrymangroup.com/media/uploads/brief/perryman-preliminary-estimates-of-economic-costs-of-the-february-2021-texas-winter-storm-02-25-21.pdf
Most expensive disasters… Harvey $125 billion, Katrina $125 billion
https://en.wikipedia.org/wiki/List_of_disasters_by_cost#cite_note-200_billion-10
(3) 73 degrees in 5 days… The polar vortex, sudden stratospheric warming and La Nina.
L’Heureux, On the sudden stratospheric warming and polar vortex of early 2021, NoOAA, Climate.gov, January 28, 2021.
https://www.climate.gov/news-features/blogs/enso/sudden-stratospheric-warming-and-polar-vortex-early-2021
(4) Sudden Stratospheric Warming, Bomb Cyclone… “Sudden Stratospheric Warmings (SSWs) are occasions in the winter (~6 times per decade), when the polar stratosphere warms and the winds that normally flow from west to east around the pole weaken dramatically and even reverse direction, corresponding to a breakdown of the polar vortex.”
L’Heureux , On the sudden stratospheric warming and polar vortex of early 2021, NOAA, January 28, 2021.
https://www.climate.gov/news-features/blogs/enso/sudden-stratospheric-warming-and-polar-vortex-early-2021
Sudden Stratospheric Warming predicted to be stronger in a warmer climate… Given that periodic weather cycles that move west to east across the globe every 30 to 60 days (Madden-Julian Oscillations) are predicted to be stronger in a warmer climate, modeling of sudden stratospheric warming events too will become more frequent, with possible implications on tropospheric high-latitude weather.
Kang and Tziperman, More Frequent Sudden Stratospheric Warming Events… in a Warmer Climate, American Meteorological Society, November 1, 2017.
https://journals.ametsoc.org/view/journals/clim/30/21/jcli-d-17-0044.1.xml
Bomb Cyclone – What is Bombogenesis? … Bombogenesis occurs when a midlatitude cyclone rapidly intensifies, dropping at least 24 millibars over 24 hours. The formation of this rapidly strengthening weather system is a process called bombogenesis, which creates what is known as a bomb cyclone.
https://oceanservice.noaa.gov/facts/bombogenesis.html
(5) Polar Vortex Weakening… (abstract) “The wintertime Arctic stratospheric polar vortex has weakened over the past three decades, and consequently cold surface air from high latitudes is now more likely to move into the middle latitudes… Here, through the analysis of various data sets and model simulations, we show that the Arctic polar vortex shifted persistently towards the Eurasian continent and away from North America in February over the past three decades. This shift is found to be closely related to the enhanced zonal wavenumber-1 waves in response to Arctic sea-ice loss, particularly over the Barents–Kara seas (BKS). Increased snow cover over the Eurasian continent may also have contributed to the shift. Our analysis reveals that the vortex shift induces cooling over some parts of the Eurasian continent and North America which partly offsets the tropospheric climate warming there in the past three decades. The potential vortex shift in response to persistent sea-ice loss in the future and its associated climatic impact, deserve attention to better constrain future climate changes.”
Zhang et al., Persistent shift of the Arctic polar vortex towards the Eurasian continent in recent decades, Nature Climate Change, October 24, 2016.
https://www.nature.com/articles/nclimate3136.epdf?referrer_access_token=-b-kbNWfGACHTN1tqzVkztRgN0jAjWel9jnR3ZoTv0MkzCzc3z7ZLHX13VkjcRLMAvMosySuuqodqaHrWHQhAY51g2pg56yzacxacAKiOjJuteu81ceDVPD7hOY3JuZaDKBPGP3djXFQ7OCiAR31ioUK4G6lFU6XDb1VwI-AjpZXFyJWsWnT4hkHAv-f97soVbUjiFCeF75Wqfm75OJCcMEbkI-j-aC56KgXct3YKRPmAocKk9iNSyTKjkfJmS678TCU8EypsQMr5w7hQ-CE7A8SJwhVJS6j1aSAuP4Ac_R0pXLz5p93vz230ZTiVqE8g4YaqAccgt4Hp_n1hE-GA2qhHV9Ubv1AoGUuYUEPXe5fgpDGGonem8pIPrgRVFguJTlPpiQFRbEcxqLtqjIR4Xet4Mpsf6qOqO0OqyvL5Go%3D&tracking_referrer=www.washingtonpost.com
(6) The disaster was caused by the for profit Texas Utility structure, poor planning and communication and by climate change…
Sabawi, What state lawmakers from San Antonio think caused Texas blackouts and how to prevent in future, KSAT.com, March 18, 2021.
https://www.ksat.com/news/local/2021/03/18/what-state-lawmakers-from-san-antonio-think-caused-texas-blackouts-and-how-to-prevent-in-future/
(7) Austin Bergstrom 164 hour below freezing record…
South-Central Texas Winter Storm Event, Event Summary, National Weather Service New Braunfels, February 10-18, 2021.
https://www.weather.gov/media/ewx/wxevents/ewx-20210218.pdf
(8) Seven Day boil water notice for Austin, Texas…
https://www.austintexas.gov/news/boil-water-notice-lifted-all-customers
Over 1 million served by Austin Water…
https://www.austintexas.gov/department/austin-water-utility/divisions#:~:text=For%20over%20100%20years%2C%20Austin,more%20than%20548%20square%20miles.
(9) Over 14.9 million without safe drinking water…
McNamara, Over 14 million Texans are still without safe water as officials grapple with crisis, CBS News, February 20, 2021.
https://www.cbsnews.com/news/texas-boil-water-notices-winter-storm/ |
(10) Of course it was climate change. The problem of non-stationarity of data and robust statistical analysis… Problem Statement #1, page 2, “Ignoring time-variant (non-stationary) behavior of extremes could potentially lead to underestimating extremes and failure of infrastructures and considerable damage to human life and society.”
Cheng, Frameworks for Univariate and Multivariate Non-Stationary Analysis of Climatic Extremes. Dissertation, Univ Cal Irvine, 2014.
https://escholarship.org/content/qt16x3s2cp/qt16x3s2cp_noSplash_df70523d588ef903df391e21a1bfd201.pdf
General Discussion… Because data must be stationary for statistics to be valid, when there is a significant change in data like is occurring with climate warming beyond the natural variability of our old climate, results of data analysis are not robust and understate. Statistical analysis assumes data do not include a changing trend, or that the data are stationary. This allows evaluation of the past to predict the future, if boundary conditions in the past are the same as in the future. If boundary conditions change, robust statistical evaluation is not possible unless the data are assumed to be stationary. This is a catch-22, or a dilemma or difficult circumstance from which there is no escape because of mutually conflicting or dependent conditions. (Oxford) This problem is particularly troublesome with climate change data that have an increasing nonlinear trend, where for example, rainfall is increasing nonlinearly with warming. Non-stationarity can be dealt with to some extent using sophisticated analysis, but if a data evaluation states “the data are assumed to be stationary,” sophisticated statistics were not used and the results of the analysis cannot be relied upon. “In the most intuitive sense, stationarity means that the statistical properties of a process generating a time series do not change over time. It does not mean that the series does not change over time, just that the way it changes does not itself change over time.”
Palachy, Stationarity in time series analysis – A review of the concept and types of stationarity, Towards Data Science (independent forum)
https://towardsdatascience.com/stationarity-in-time-series-analysis-90c94f27322
(11) Natural Variation of our old climate maxes out at 0.5 degrees C warming above normal… Warming beyond natural variation of our old climate forces ecologies to collapse and revolve, degrading, eliminating or reversing services provided by those ecologies like carbon sequestration. This natural variation in our old climate represent the boundary conditions of our Earth system evolution.
King 2015… King et al., defines “anthropogenic emergence” as the point where our climate warmed beyond its stable natural variability, as some point near or not too long after the year 2000, where we warmed beyond the 0.5 C.
King et al., The timing of anthropogenic emergence in simulated climate extremes, Environmental Research Letters, September 10, 2015.
https://iopscience.iop.org/article/10.1088/1748-9326/10/9/094015/pdf
Hansen 2017… “Young people’s burden…” defines he maximum warming or our old climate, or the maximum range of natural variability of our old climate as 0.25 to 0.75 C warming, with a midpoint of 0.5 C.
Hansen, Young People’s Burden: Requirement of Negative CO2 Emissions, Earth Systems Dynamics, July 18, 2017, Figure 12.
https://www.earth-syst-dynam.net/8/577/2017/esd-8-577-2017.pdf
Lenton 2019… Lenton’s tipping point article tells us more than half of known tipping points have activated since about 2010, which coincides well with climate change warming beyond 0.5 C.
Lenton et al., Climate tipping points-too risky to bet against, Nature, November 27, 2019.
https://www.nature.com/articles/d41586-019-03595-0
Randers and Goluke 2020… Randers and Goluke have identified a tipping point with permafrost collapse of 0.5 C warming.
Randers and Goluke, An earth system model shows self-sustained melting of permafrost even if all man-made GHG emissions stop in 2020, Nature Scientific Reports, November 12, 2020.
https://www.nature.com/articles/s41598-020-75481-z
(12) Covid-19 and the climate change connection… Shifting bat populations from warming, increased bat stress from habitat loss and warming, and increased bat to human contact because of habitat loss are all plausible pathways to the onset of Covid-19.
Beyer et al., Shifts in global bat diversity suggest a possible role of climate change in the emergence of SARS-CoV-1 and SARS-CoV-2, Science of the Total Environment, May 1, 2021.
https://www.sciencedirect.com/science/article/pii/S0048969721004812?via%3Dihub
(13) More than half of known tipping points are now active up to 100 years ahead of projections… Nine Earth systems collapses have been identified by scientists as active: Arctic sea ice, Greenland ice sheet, boreal forests, permafrost, the Gulf Stream, the Amazon, coral, the West Antarctic Ice Sheet and parts of the East Antarctic Ice Sheet. Until 2018, the Intergovernmental Panel on Climate Change (IPCC) has assumed that tipping would not occur before 5 C of warming above preindustrial times, something that the worst-case scenario put well into the 22nd century. In 2018 however, IPCC lowered this limit to between 1 and 2 C above preindustrial times in both the 1.5 C Report and the Cryosphere Report. Lenton tells us, “The Intergovernmental Panel on Climate Change (IPCC) introduced the idea of tipping points two decades ago. At that time, these ‘large-scale discontinuities’ in the climate system were considered likely only if global warming exceeded 5 °C above pre-industrial levels. Information summarized in the two most recent IPCC Special Reports (published in 2018 and in September this year) suggests that tipping points could be exceeded even between 1 and 2 °C of warming.” Climate tipping is now active greater than 100 years ahead of projections.
Selected quotes from the Exeter press release… “More than half of the climate tipping points identified a decade ago are now “active”, a group of leading scientists have warned. This “cascade” of changes sparked by global warming could threaten the existence of human civilization, Evidence is mounting that these events are more likely and more interconnected than was previously thought, leading to a possible domino effect. It is not only human pressures on Earth that continue rising to unprecedented levels. It is also that as science advances, we must admit that we have underestimated the risks of unleashing irreversible changes, where the planet self-amplifies global warming. This is what we now start seeing, already at 1°C global warming. No amount of economic cost–benefit analysis is going to help us. We need to change our approach to the climate problem.”
Selected quotes from the paper… “The Intergovernmental Panel on Climate Change (IPCC) introduced the idea of tipping points two decades ago. At that time, these ‘large-scale discontinuities’ in the climate system were considered likely only if global warming exceeded 5 °C above pre-industrial levels. Information summarized in the two most recent IPCC Special Reports (published in 2018 and in September this year) suggests that tipping points could be exceeded even between 1 and 2 °C of warming.” Perhaps the most salient part of this work is that tipping points seem to be interrelated. The authors make strong links that 45 percent of tipping points create positive feedbacks that increase the reaction of other tipping points through dynamic global effects.
Lenton et al., Climate tipping points-too risky to bet against, Nature, November 27, 2019
https://www.nature.com/articles/d41586-019-03595-0
University of Exeter Press –
http://www.exeter.ac.uk/news/featurednews/title_767753_en.html
(14) Climate Emergency Declared in Bioscience, “potentially making large parts of Earth uninhabitable”… Over 13,000 scientists have signed a letter declaring a climate emergency is underway in the journal Biosciences…”Scientists have a moral obligation to clearly warn humanity of any catastrophic threat and to ‘tell it like it is.’ On the basis of this obligation and the graphical indicators presented below, we declare, with more than 11,000 scientist signatories from around the world, clearly and unequivocally that planet Earth is facing a climate emergency.”
Selected quotes… “The climate crisis has arrived and is accelerating faster than most scientists expected… It is more severe than anticipated, threatening natural ecosystems and the fate of humanity… Especially worrisome are potential irreversible climate tipping points and nature’s reinforcing feedbacks (atmospheric, marine, and terrestrial) that could lead to a catastrophic ‘hothouse Earth,’ well beyond the control of humans… These climate chain reactions could cause significant disruptions to ecosystems, society, and economies, potentially making large areas of Earth uninhabitable. An immense increase of scale in endeavors to conserve our biosphere is needed to avoid untold suffering due to the climate crisis.”
Ripple et al., World Scientists’ Warning of a Climate Emergency, Bioscience, November 5, 2019.
https://academic.oup.com/bioscience/article/70/1/8/5610806
Over 13,000 signatories… Alliance of World Scientists
https://scientistswarning.forestry.oregonstate.edu/
(15) Arctic Sea Ice decline 50 years ahead of schedule… Summertime melting of Arctic sea-ice has ‘‘accelerated far beyond the expectations of climate models.’’ Using unusually vivid language, the authors note that the record for previous Arctic sea ice summer minimum extent was ‘‘shattered’’ in 2007, ‘‘something not predicted by climate models . . . This dramatic retreat has been much faster than simulated by any of the climate models assessed in the IPCC AR4 (fourth IPCC report)’’ with summer sea ice now well below the IPCC worst case scenario. The 50 years faster than projections statement comes from comparing IPCC AR4 projections with current data from the National Snow and Ice Data Center, then mapping that data onto Stroeve 2011.
Stroeve et al, The Arctic’s rapidly shrinking sea ice cover—A research synthesis, Climatic Change, 110, 1005-1027, 2012, published online June 2011.
http://www.springerlink.com/content/c4m01048200k08w3/fulltext.pdf
National Snow and Ice Data Center, Arctic Sea Ice Extent.
https://nsidc.org/arcticseaicenews/charctic-interactive-sea-ice-graph/
(16) Arctic amplification and the jet stream… “Over the past several decades, the number of extreme weather events has increased. During those same years, the Arctic has warmed twice as fast as the rest of the Northern Hemisphere. The rapid Arctic warming is referred to as Arctic Amplification, and research suggests that it may be blamed for some of the extreme weather episodes.”
EarthNow: How does the Arctic Affect Extreme Weather? National Oceanic and Atmospheric Administration, NOAA.
https://sos.noaa.gov/datasets/earthnow-how-does-the-arctic-affect-extreme-weather/
(17) Cascading climate change impacts… (abstract) “Our understanding of the extent to which these impacts may propagate as cascades, compounding to form multiple impacts across sectors, is limited. Cascades result from interdependencies between systems and sub-systems of coupled natural and socio-economic systems in response to changes and feedback loops. The combined effects of interacting stressors may affect the ability of individuals, governments, and the private sector to adapt in time, before widespread damage occurs.”
Lawrence et al., Cascading climate change impacts and implications, Climate Risk Management, April 30, 2020.
https://www.sciencedirect.com/science/article/pii/S2212096320300243
And… “New research is drawing attention to the potential for climate change to generate cascading impacts and implications across linked human-environment systems, requiring closer accounting of these interactions to anticipate the emergence of surprises and feedbacks.”
Cradock-Henry et al., Elaborating a systems methodology for cascading climate change impacts and implications, MethodsX, 7, 2020.
https://reader.elsevier.com/reader/sd/pii/S2215016120301126?token=252DBAF6A9FC1DF86C6552F0176924F6FB0BB82364E5A3D02139994A59EA9122092E7320B623B658B53ACA9815DDCD58
(18) Eleven feet amputated at Ascension-Seton… More had partial amputations. Ascension Seton is just one of the Austin region’s three major hospital systems.
Austin doctors: February frostbite cases like nothing they’ve seen before, March 22, 2201.
https://www.google.com/search?q=eleven+feet+amputated+austin&rlz=1C1AFAB_enUS944US944&oq=eleven+feet+amputated+austin&aqs=chrome..69i57j33i160l2.5163j0j15&sourceid=chrome&ie=UTF-8
(19) Anthropogenic Emergence – The Timing of When Climate Change Warmed Above Natural Variability… Anthropogenic emergence is the time when the Anthropocene began. The Anthropocene is a new geologic epoch defined by humankind’s ability to change our climate with greenhouse gas pollution. Warming rose above natural variability right about the turn of the twenty-first century when we warmed above 0.5 degrees C above normal.
King et al., The timing of anthropogenic emergence in simulated climate extremes, Environmental Research Letters, September 10, 2015.
http://iopscience.iop.org/article/10.1088/1748-9326/10/9/094015
(20) The 100-year storm… A 100-year storm, or any 100-year event, refers to the statistical probability that event will occur in our old climate. Specifically, a 100-year event has a one percent probability of recurrence in any given year. For those of us who are not statistically bent, a 100-year storm happens on average over long time periods once every 100 years.
Floods: Recurrence intervals and 100-year floods , US Geological Survey
https://www.usgs.gov/special-topic/water-science-school/science/100-year-flood?qt-science_center_objects=0#qt-science_center_objects
(21) Ecological collapse by boundary conditions exceedance… When an ecological system’s boundary conditions are exceeded (temperature, precipitation, weather event duration, or other environmental conditions like soil and water pH, etc.) it collapses because the system becomes toxic to its inhabitants who have evolved within the boundary conditions of that system. If the perturbation to the system is removed, it can often self-restore, but if the perturbation continues or increases, reevolution occurs, but only once the boundary conditions stabilize. Ecological Collapse, Wikipedia.
https://en.wikipedia.org/wiki/Ecological_collapse
(22) Impacts increase nonlinearly with warming… For an in depth look at how warming increases extremes nonlinearly, see the IPCC Special Report on our Oceans and Cryosphere, Chapter 6, Extremes, Abrupt Changes and Managing Risks.
IPCC Special Report on the Ocean and Cryosphere in a Changing Climate, 2019.
https://www.ipcc.ch/site/assets/uploads/sites/3/2019/11/10_SROCC_Ch06_FINAL.pdf
Nonlinear Geophysical Processes… The Nonlinear Processes in Geosciences (NP) Division of the European Geosciences Union (EGU) is an extremely valuable resource to understand the wide and very meaningful concept of nonlinearity of impacts with climate warming. From the NP EGU, “This blog serves as a platform for the nonlinear processes community to share news, events, and activities, as well as updates on the latest research being undertaken.”
Division of Nonlinear Geophysical Processes, European Geophysical Union
https://blogs.egu.eu/divisions/np/
Precipitation… Basic physics tells us that evaporation increases nonlinearly with warming. Vapor pressure defines evaporation. At 0 degrees C (freezing, 32 F,) water vapor pressure is near zero, but at 30 C (86 F) water vapor pressure is over 30 times greater than at freezing. “The relationship between vapor pressure and temperature is not linear — the vapor pressure of water increases more rapidly than the temperature of the system.”
http://chemed.chem.purdue.edu/genchem/topicreview/bp/ch14/liquids.php
El Nino Southern Oscillation hydrologic impacts increase nonlinearly with global warming… Warming increases ENSO rainfall because of moisture sensitivity and dynamic contributions.
Yun et al., Increasing ENSO–rainfall variability due to changes in future tropical temperature–rainfall relationship, Nature Communications Earth and Environment, February 21, 2021.
https://www.nature.com/articles/s43247-021-00108-8.pdf
Flooding… Flooding has increased nonlinearly across the Western US because of increase precipitation as rain.
Davenport et al., Flood Size Increases Nonlinearly Across the Western United States in Response to Lower Snow‐Precipitation Ratios, Water Resource Research December 2019.
https://agupubs.onlinelibrary.wiley.com/doi/10.1029/2019WR025571
For heat extremes… Rahmstorf and Coumou tell us about heat extremes, “For extremes exceeding a predefined threshold, the dependence on the warming trend is highly nonlinear.”
Rahmstorf and Cuomou, Increase of extreme events in a warming world, PNAS, November 1, 2011.
https://www.ncbi.nlm.nih.gov/pmc/articles/PMC3207670/pdf/pnas.1101766108.pdf
Hansen – Heat extremes have already increased by up to 100 times in the Texas Oklahoma heat wave of 2011.
Fire Behavoir… Large California Wildfires are increasing nonlinearly with drying and earlier onset of spring… “Increases in large wildfires associated with earlier spring snowmelt scale exponentially with changes in moisture deficit, and moisture deficit changes can explain most of the spatial variability in forest wildfire regime response to the timing of spring.”
Westerling, Increasing western US forest wildfire activity, sensitivity to changes in the timing of spring, Philosophical Transactions of the Royal Society B, May 23, 2016, abstract.
http://rstb.royalsocietypublishing.org/content/371/1696/20150178
(23) Hurricane Harvey, a 1-million year storm… Capital Weather Gang says that Houston’s 60 inches of rainfall during Harvey is a 1-million-year storm: paragraph 2.
Texas Flood Disaster: Harvey has Unloaded 9 Trillion Gallons of Water,
https://www.washingtonpost.com/news/capital-weather-gang/wp/2017/08/27/texas-flood-disaster-harvey-has-unloaded-9-trillion-tons-of-water/?utm_term=.a36242b4414d
(24) One in three heat related deaths (37%) caused by climate change… ” Here, we use empirical data from 732 locations in 43 countries to estimate the mortality burdens associated with the additional heat exposure that has resulted from recent human-induced warming, during the period 1991–2018. Across all study countries, we find that 37.0% (range 20.5–76.3%) of warm-season heat-related deaths can be attributed to anthropogenic climate change and that increased mortality is evident on every continent.”
Vicedo-Cabrera et al., The burden of heat-related mortality attributable to recent human-induced climate change, nature Climate Change, May 31, 2021.
(Paywall) https://www.nature.com/articles/s41558-021-01058-x
(25) The 2018 Camp Fire in Paradise burned 14,000 homes in just 6 hours… The Camp Fire in Paradise, California became the most destructive and deadly fire in California history, with over 18,000 destroyed structures, 700 damaged structures, and 85 fatalities.
Maranghides, A study of the Camp Fire – Fire Progression Timeline, NIST Technical Note 2135, February 8, 2021.
Summary and link to paper – https://www.nist.gov/publications/case-study-camp-fire-fire-progression-timeline
Paper – https://nvlpubs.nist.gov/nistpubs/TechnicalNotes/NIST.TN.2135.pdf
(26) Permafrost collapse emits on average 2.3 Gt CO2 annually from 2003 to 2017… Emission are average per year from 2003 – 2017. With permafrost melt increasing rapidly today, this means emission in 2017 were much more than in 2003, therefore much more than the 2.3 Gt per year estimated on average.
Natali et al., Large loss of CO2 in winter observed across the northern permafrost region, Nature Climate Change, October 21, 2019.
https://www.uarctic.org/media/1600119/natali_et_al_2019_nature_climate_change_s41558-019-0592-8.pdf
(27) Transportation emissions of 7 GT CO2eq or 6.7 Gt CO2 annually…
IPCC 2013, Physical Science Basis, Chapter 8, Transport
https://www.ipcc.ch/site/assets/uploads/2018/02/ipcc_wg3_ar5_chapter8.pdf
(28) National Oceanic and Atmospheric Administration (NOAA) 1.5 inches of sea level rise in 2019, doubling the previous record… In 2019, RSL along U.S. coastlines (median value) reached an all-time record of 0.34 m since 1920 (last 100 years), which is about 4 centimeters (1.5 inches) higher than it was in 2018. The national RSL (linear) trend along U.S. coastlines examined here is 2.8 millimeters/year over this period (not shown). Inherent to the RSL measurement in Figure 3a is the effect of land subsidence, which nationally (median plus or minus standard deviation value of the 98 tide gauges monitored) is occurring at a rate of 0.7 ±1.4 mm/year, but can be as high as 7 mm/year along the coastline of Louisiana (Zervas et al., 2013; Sweet et al., 2017). Annual mean RSLs at most East and Gulf Coast tide gauges (57 of the 62) broke their historical records (Figure 3b) in 2019 by (median value) 2.6 cm (about 1 inch).”
Press Release – NOAA, U.S. high-tide flooding continues to increase, July 14, 2020
https://www.noaa.gov/media-release/us-high-tide-flooding-continues-to-increase
NOAA 2019 State of U.S. High Tide Flooding with a 2020 Outlook, TR 092, July 2020, page 3 and 4.
https://tidesandcurrents.noaa.gov/publications/Techrpt_092_2019_State_of_US_High_Tide_Flooding_with_a_2020_Outlook_30June2020.pdf
Also see a letter from principle William Sweet – 23 July 2020.
https://oceanservice.noaa.gov/aa-updates/high-tide-flooding-outlook-072320.html
(29) Beach and Barrier Island disintegration threshold is 5 to 7 mm sea level rise per year… Low-profile beach geometry is similar for most of the Gulf and East Coasts, so this document can serve as a guide to current and future sea level rise degradation of beaches and wetlands along most of the heavily populated US coast, because most of the US coast -by mileage- consists of low profile beaches. (Heavily populated excludes Alaska, and Louisiana is a special case.)
— Existing conditions in 2009: 3 to 4 mm sea level rise, about 90% of beaches are being degraded by overwash, erosion and island breaching. A threshold condition may already exist for the most vulnerable category where barrier island segmentation and disintegration could be occurring. Five percent of existing wetlands have been converted to open water and 15 to 20% could be threatened.
— With 2 mm additional sea level rise or 5 to 7 mm rise per year, thresholds condition develop for barrier island segmentation and disintegration on about 25% of barrier islands and could develop across another 25%. Existing wetlands converted to open water increases to 15 to 20% and an additional 80 percent could be threatened.
— With 7 mm additional sea level rise, or 10 to 11 mm of sea level rise per year, thresholds condition develop for barrier island segmentation and disintegration on about 60% of barrier islands and could develop across another 30%. Existing wetlands converted to open water increases to 85% and an additional 5 % could be threatened.
Climate Change Science Program 2009, Coastal Sensitivity to Sea Level Rise – Focus on the Mid-Atlantic Region, Washington, DC: US Environmental Protection Agency. https://www.globalchange.gov/sites/globalchange/files/sap4-1-final-report-all.pdf
(30) Adaptability limit to SLR of three feet per century… Greater than three feet per century results in unrecoverable economic scenarios… IPCC tells us that “Nicholls et al. (2011) show that only a limited number of adaptation options are available for specific coastal areas if sea level exceeds a certain threshold (1 m) at the end of the century.”
Climate Change 2014: Impacts, Adaptation, and Vulnerability. Part A: Global and Sectoral Aspects. Contribution of Working Group II to the Fifth Assessment Report of the Intergovernmental Panel on Climate Change, page 393, paragraph 10.
https://www.ipcc.ch/site/assets/uploads/2018/02/WGIIAR5-PartA_FINAL.pdf
(31) Antarctic Ice Sheet Collapse is 100 years ahead of schedule… Antarctic surface mass balance (SMB) in the 2007 IPCC Report was supposed to increase, not decrease, for all scenarios, through 2100. This means that snow accumulation was supposed to be more than melt, evaporation and iceberg discharge combined: “All studies for the 21st century project that Antarctic SMB changes will contribute negatively to sea level, owing to increasing accumulation exceeding any ablation increase (see Table 10.6).” (See also Reference 9 in Vision Statement)
Intergovernmental Panel on Climate Change, Fourth Assessment Report, Climate Change 2007: Working Group I: The Physical Science Basis, 10.6.4.1, Surface Mass Balance, fifth paragraph.
https://www.ipcc.ch/publications_and_data/ar4/wg1/en/ch10s10-6-4-1.html
The 2013 IPCC report tells us that Antarctic ice loss has almost caught up with Greenland. Summary for Policy Makers, E.3 Cryosphere, page 9, third bullet. “The average rate of ice loss from the Antarctic ice sheet has likely increased from 30 [–37 to 97] Gt yr–1 over the period 1992–2001 to 147 [72 to 221] Gt yr–1 over the period 2002 to 2011.” Greenland, second bullet: “The average rate of ice loss from the Greenland ice sheet has very likely substantially increased from 34 [–6 to 74] Gt yr–1 over the period 1992 to 2001 to 215 [157 to 274] Gt yr–1 over the period 2002 to 2011.”
http://www.climatechange2013.org/images/report/WG1AR5_SPM_FINAL.pdf
(32) Permafrost collapse is 70 years… “Observed maximum thaw depths at our sites are already exceeding those projected to occur by 2090 under representative concentration pathway version 4.5.”
Farquharson et al., Climate Change Drives Widespread and Rapid Thermokarst Development in Very Cold Permafrost in the Canadian High Arctic, Geophysical Research Letters, June 10, 2019.
https://agupubs.onlinelibrary.wiley.com/doi/epdf/10.1029/2019GL082187
(33) Major hurricane intensity increases more than 50 years ahead of projections… Findings in the Proceedings of the National Academy of Sciences in May 2020 (Kossin) showed major Cat 3 through 5 hurricane intensity has increased 32 percent average up to 60 percent globally from 1979 to 2017. Previous work showed only increases in intensity of Atlantic Basin hurricanes. Knutson 2020 showed a theoretical average intensity increase of 13 percent in Cat 4 and 5 tropical storms with 2 C warming. Considering 2 C would happen late 21st century, increasing hurricane intensity is more than 50 years ahead of projections.
Increased intensity of 32% average, up 60 percent 1979-2017 of major hurricanes Cat 3 to 5, globally… Increase in hurricane strength 50 plus years ahead of projections. See Knutson 2020 for theoretical projections.
Kossin et al, Global Increase in Major Tropical Cyclone Exceedance Probability Over the Last Four Decades, PNAS, May 4, 2020.pdf
(Paywall) https://www.pnas.org/content/117/22/11975
PNAS Press Release: Trends in tropical cyclone intensity
https://www.eurekalert.org/pub_releases/2020-05/potn-tit051320.php
Theoretical increase of 15% average for major hurricanes Cat 4 and 5 with 2 degrees C warming.
Knutson et al., Tropical Cyclones and Climate Change – Part II, Projected Response to Anthropogenic Warming, BAMS, March 2020.
https://journals.ametsoc.org/bams/article/101/3/E303/345043/Tropical-Cyclones-and-Climate-Change-Assessment
(34) Upper ocean stratification increasing six times faster than projected… “Using a physically based definition of upper-ocean stability that follows different dynamical regimes across the global ocean, we find that the summertime density contrast increased by 8.9±2.7 per cent per decade (10−6–10−5 persecond squared per decade, depending on region), more than six times greater than previous estimates. Whereas prior work has suggested that a thinner mixed layer should accompany a more stratified upper ocean5–7, we find instead that the summertime mixed layer deepened by 2.9±0.5 per cent per decade, or several metres per decade (typically 5–10 metres per decade, depending on region). A detailed mechanistic interpretation is challenging, but the concurrent stratification and deepening of the mixed layer are related to an increase in stability associated with surface warming and high-latitude surface freshening8,9, accompanied by a wind-driven intensification of upper-ocean turbulence.”
Sallee et al., Summertime increases in upper-ocean stratification and mixed-layer depth, Nature, March 24, 2021.
https://www.nature.com/articles/s41586-021-03303-x.epdf?sharing_token=XlKX9VCiIgSQTw2tGjb099RgN0jAjWel9jnR3ZoTv0PrbOhVC9HiOzy2kA3717nTIai2p2njuhAj72RwpttABzK6dU3sYwCcIH3ijNB62fN2MrQTgCxvuKUa1vm4fDHYlkWB37EYggQQgepBK_r-KZFQo2q8BRF_sfQDf39Wa9o%3D
(35) Intense rainfall today is already triple the IPCC 2100 projection in Houston and double in Austin… The 2013 IPCC report tells us that by 2081 to 2100, Houston will see up to a ten percent increase in total 5-day, 20-year precipitation accumulation. The USGS published total 5-day precipitation for the 25-year storm in our old climate was about 12 inches in Houston. In Atlas 14, the 25-year, 5-day storm depth is about 16 inches (interpolated), an increase of 39 percent — already, in 2018, not 2081 to 2100. The actual measured increase in precipitation extremes are 60 to 80 years ahead of schedule and three times as much as IPCC projected for 2100.
Austin… Austin increase ahead of projections: IPCC fig 12.26 shows up to a 10 percent increase in 5-day, 20-year precipitation maximum precipitation. Austin’s 2004 5-day, 25-year was 9.5 inches. Atlas 14 shows the 5-day 25-year at about 11.4 inches (interpolated), an increase of 20 percent, double what IPCC projected for 2100.
Austin 100-year now the 25-year – http://www.austintexas.gov/page/flood-risk-and-atlas-14-details
IPCC AR5 2080 to 2100 projection: Scientific Basis, Chapter 12, Figure 12.26, page 1083.|
https://www.ipcc.ch/report/ar5/wg1/
USGS, 5-day, 25-year event, 12 inches in Houston. 9.5 inches in Austin. Atlas of Depth-Duration Frequency of Precipitation Annual Maxima for Texas, USGS, 2004, Figure 50, page 57.
https://pubs.usgs.gov/sir/2004/5041/pdf/sir2004-5041.pdf
NOAA Atlas 14, 5-day, 25-year event, 16 inches in Houston, 11.4 inches in Austin…
https://hdsc.nws.noaa.gov/hdsc/pfds/pfds_map_cont.html
(36) Southwestern North America in megadrought, currently worse than last 1200 years… Southwestern North America is 20 years in to a megadrought that rivals the worst megadrought in the last 1200 years. Naturally, these droughts can last for hundreds of years and are ten to a hundred times worse than the Dust Bowl, but this one is caused by human warming.
Williams, Large contribution from anthropogenic warming to an emerging North American megadrought, Science, April 17, 2020.
(Research Gate Free Subscription) https://www.researchgate.net/publication/340697253_Large_contribution_from_anthropogenic_warming_to_an_emerging_North_American_megadrought
(37) The largest California fires ever…
Largest California Fires: From the 2017 Thomas Fire at 282,000 acres, to the 2020 August Complex at 1,032,649 acres.
Total burned area: 2020 – 4,397,809 acres, 2018 – 1,975,086 acres
Wikipedia, list of California Wildfires
https://en.wikipedia.org/wiki/List_of_California_wildfires
(38) Ten to Fourteen Percent of All Sequoias Globally Burned in the Sequoia Complex Fire… “The loss of 7,500 to 10,600 large giant sequoias, many of which are likely thousands of years old, is devastating,” the study’s lead author, Dr. Christy Brigham, chief of Resources Management and Science at Sequoia and Kings Canyon National Parks, told CNN. “These trees are irreplaceable in our lifetimes.”
Pre-release – https://www.cnn.com/2021/06/03/us/sequoias-lost-california-wildfire/index.html?utm_source=fbCNN&utm_content=2021-06-03T22%3A46%3A03&utm_term=link&utm_medium=social&fbclid=IwAR2kOdobk_XdcU0WIcUFsSR_nZykgHV7jltYuoxtupv60wTP3KTXcljgZCI
(39) Calfire says 400 degrees hotter… Wildfires are burning 400 degrees hotter because of drier fuels. “The infernos bellowed by those winds once reached a maximum temperature of 1,700 degrees Fahrenheit, Cal Fire’s Angie Lottes says; now they reach 2,100 degrees, hot enough to turn the silica in the soil into glass.”
Wallace-Wells, Los Angeles Fire Season Is Beginning Again. And It Will Never End. A bulletin from our climate future.
By David Wallace-Wells, NYMag, May 12, 2019.
http://nymag.com/intelligencer/2019/05/los-angeles-fire-season-will-never-end.html
(40) Five of the six largest fires in California’s history happened in 2020, Pre-human levels… The largest fires in California History, ranked:
Fire Area (Acres) Date
August Complex 1,032,649 August 2020
Mendocino Complex 459,123 July 2018
SCU Lightning Complex 396,624 August 2020
Creek 379,895 September 2020
LNU Lightning Complex 363,220 August 2020
North Complex 318,935 August 2020
Thomas 281,893 December 2017
(41) Fire Burned area in California at pre European ara in 2020… During pre-European times, an average of 4.4 million acres of California burned every year, approximately equaling the 2020 total of 4,397,809 acres.
Stephens et al., Prehistoric fire area and emissions from California’s forests, woodlands, shrublands and grasslands, Forest and Ecology Management, June 6, 2007.
https://nature.berkeley.edu/stephenslab/wp-content/uploads/2015/04/Stephens-et-al.-CA-fire-area-FEM-2007.pdf
(42) $1.3 billion in California fire suppression in 2020… California’s emergency firefighting costs are expected to hit $1.3 billion in 2020, pushing the California Department of Forestry and Fire Protection’s total spending this fiscal year to more than $3 billion.
https://www.latimes.com/environment/story/2020-12-23/billions-spent-fighting-california-wildfires-little-on-prevention
(43) Forests failing to regenerate after fire have doubled since 2000… Conclusion, “Significantly less tree regeneration is occurring after wildfires in the start of 21st century compared to the end of the 20th century, and key drivers of this change were warmer and drier mean climatic conditions. Our findings demonstrate the increased vulnerability of both dry and moist forests to climate-induced regeneration failures following wildfires. The lack of regeneration indicates either substantially longer periods of forest recovery to pre-fire tree densities, or potential shifts to lower density forests or non-forest cover types after 21st-century wildfires… Our results suggest that predicted shifts from forest to non-forested vegetation may be underway, expedited by fire disturbances [and] that short post-fire periods of wetter climate that have favoured tree regeneration in the past may not occur frequently enough to facilitate tree regeneration in the future, across a broad region and multiple forest types in the Rocky Mountains… Our results suggest a high likelihood that future wildfires will facilitate shifts to lower density forest or non-forested states under a warming climate.”
Data… “For sites burned at the end of the 20th century vs. the first decade of the 21st century, the proportion of sites meeting or exceeding pre-fire tree densities (e.g. recruitment threshold of 100%) decreased by nearly half (from 70 to 46%) and the percentage of sites experiencing no post-fire tree regeneration nearly doubled (from 19 to 32%)… This negative relationship demonstrates the potential increased vulnerability and lack of resilience on hotter and drier sites, or of dry forest species, to climate warming… Tree seedlings may establish in response to short-term anomalous wetter periods in the future, but our results highlight that such conditions have become significantly less common since 2000, and they are expected to be less likely in the future… Further, persistent or long-lasting vegetation changes following wildfires have been observed worldwide.”
Stevens-Rumann et al., Evidence for declining forest resilience to wildfires under climate, Ecology Letters, December 12, 2017. (paywall)
Press Release, University of Montana –
https://www.eurekalert.org/pub_releases/2017-12/tuom-sfr121317.php
Stevens-Rumann et al., Evidence for declining forest resilience to wildfires under climate. Ecology Letters, December 12, 2017.
https://www.researchgate.net/profile/Monica_Rother/publication/321753770_Evidence_for_declining_forest_resilience_to_wildfires_under_climate_change/links/5a315ae90f7e9b2a284cea8f/Evidence-for-declining-forest-resilience-to-wildfires-under-climate-change.pdf
(44) Repeatedly unprecedented California fires – It’s not Smokey Bear Era fire suppression, it’s climate change: drying, heat, temperature, ignition, winds…
Abstract “Recent fire seasons have fueled intense speculation regarding the effect of anthropogenic climate change on wildfire in western North America and especially in California. During 1972–2018, California experienced a fivefold increase in annual burned area, mainly due to more than an eight fold increase in summer forest‐fire extent. Increased summer forest‐fire area very likely occurred due to increased atmospheric aridity caused by warming. Since the early 1970s, warm‐season days warmed by approximately 1.4°C as part of a centennial warming trend, significantly increasing the atmospheric vapor pressure deficit (VPD). These trends are consistent with anthropogenic trends simulated by climate models. The response of summer forest‐fire area to VPD is exponential, meaning that warming has grown increasingly impactful. Robust interannual relationships between VPD and summer forest‐fire area strongly suggest that nearly all of the increase in summer forest‐fire area during 1972–2018 was driven by increased VPD. Climate change effects on summer wildfire were less evident in nonforested lands. In fall, wind events and delayed onset of winter precipitation are the dominant promoters of wildfire. While these variables did not change much over the past century, background warming and consequent fuel drying is increasingly enhancing the potential for large fall wildfires. Among the many processes important to California’s diverse fire regimes, warming‐driven fuel drying is the clearest link between anthropogenic climate change and increased California wildfire activity to date.”
Williams et al., Observed Impacts of Anthropogenic Climate Change on Wildfire in California, Earth’s Future, August 4, 2019.
https://agupubs.onlinelibrary.wiley.com/doi/epdf/10.1029/2019EF001210
Large California Wildfires are increasing nonlinearly with drying and earlier onset of spring… “Increases in large wildfires associated with earlier spring snowmelt scale exponentially with changes in moisture deficit, and moisture deficit changes can explain most of the spatial variability in forest wildfire regime response to the timing of spring.”
Westerling, Increasing western US forest wildfire activity, sensitivity to changes in the timing of spring, Philosophical Transactions of the Royal Society B, May 23, 2016, abstract.
http://rstb.royalsocietypublishing.org/content/371/1696/20150178
Most acute fire weather: Winds, drought, fuel moisture… Summary and Conclusions: “most acute fire weather in over two decades… longest duration Santa Ana wind event in the 70-year record… the most extreme drought on record… lowest fuel moisture on record… driest March through December since 1895.”
Nauslar et al., The 2017 North Bay and Southern California Fires, A Case Study, Fire, June 9, 2018.
https://www.mdpi.com/2571-6255/1/1/18/htm
(45) Number of fires in California has fallen by 50 percent in the last 30 years… Based on Calfire fires.
Redbook 2008, CalFire reported an average over 6,000 fires, 1999 to 2004.
https://www.fire.ca.gov/media/10885/2008_wildfireactivitystatistics_complete_revised.pdf
Redbook 2019, CalFire reported an average of a little over 3,000 fires from 2010 through 2019.
https://www.fire.ca.gov/media/iy1gpp2s/2019_redbook_final.pdf
(46) New drought type – ecological drought… “Droughts of the 21st century are characterized by hotter temperatures, longer duration and greater spatial extent, and are increasingly exacerbated by human demands for water. This situation increases the vulnerability of ecosystems to drought, including a rise in drought-driven tree mortality globally (Allen et al. 2015) and anticipated ecosystem transformations from one state to another, e.g., forest to a shrubland (Jiang et al. 2013).”
Crausbay et al, Defining Ecological Drought for the Twenty-First Century BAMS, December 2017.
https://journals.ametsoc.org/doi/pdf/10.1175/BAMS-D-16-0292.1
(47) Amazon collapse is more than 100 years ahead of schedule Flipping From Carbon Sink to Carbon Source three times since 2005… The Amazon has flipped from carbon sink to carbon source three times 2005, 2010, 2016, with 100-year or more extreme drought, each increasing in severity from the previous event. Flipping three times is a fair enough interpretation. In 2010, the Amazon was near neutral with carbon emissions of 0.07 gigaton C (256 megatons CO2 equivalent.) The 2005 drought created emissions of 0.43 gigaton C (1.6 PgC reduction – 1.1 PgC) or 1.6 gigatons C. The 2016 drought was more severe than either, but the quantity of emissions has not yet been published.
2005 and 2010 Droughts… (Abstract) “Based on these ground data, live biomass in trees and corresponding estimates of live biomass in lianas and roots, we estimate that intact forests in Amazonia were carbon neutral in 2010 (-0.07 Pg C yr1 CI: -0.42, 0.23), consistent with results from an independent analysis of airborne estimates of land-atmospheric fluxes during 2010. Relative to the long-term mean, the 2010 drought resulted in a reduction in biomass carbon uptake of 1.1 Pg C, compared to 1.6 Pg C for the 2005 event.” Therefore, if the 2010 drought was carbon neutral, the 2005 drought resulted in carbon emissions.
Feldpausch, Amazon forest response repeated droughts, Global Biogeochemical Cycles, July 1, 2016.
https://agupubs.onlinelibrary.wiley.com/doi/full/10.1002/2015GB005133
Yang et al. 2018, say that the 2005 Amazon drought continued to create carbon emissions through 2008 of 1.1 gigatons CO2 per year.
Yang et al., Post-drought decline of the Amazon carbon sink, Nature, August 9, 2018.
https://www.nature.com/articles/s41467-018-05668-6
2016 Drought… (Abstract) Tropical and sub-tropical South America are highly susceptible to extreme droughts. Recent events include two droughts (2005 and 2010) exceeding the 100-year return value in the Amazon and recurrent extreme droughts in the Nordeste region, with profound eco-hydrological and socioeconomic impacts. In 2015–2016, both regions were hit by another drought. Here, we show that the severity of the 2015–2016 drought (“2016 drought” hereafter) is unprecedented based on multiple precipitation products (since 1900), satellite-derived data on terrestrial water storage (since 2002) and two vegetation indices (since 2004). The ecohydrological consequences from the 2016 drought are more severe and extensive than the 2005 and 2010 droughts. Empirical relationships between rainfall and sea surface temperatures (SSTs) over the tropical Pacific and Atlantic are used to assess the role of tropical oceanic variability in the observed precipitation anomalies. Our results indicate that warmer-than-usual SSTs in the Tropical Pacific (including El Niño events) and Atlantic were the main drivers of extreme droughts in South America, but are unable to explain the severity of the 2016 observed rainfall deficits for a substantial portion of the Amazonia and Nordeste regions. This strongly suggests potential contribution of nonoceanic factors (e.g., land cover change and CO2-induced warming) to the 2016 drought.
Erfanian et al., Unprecedented drought over tropical South America in 2016 significantly under-predicted by tropical SST, Nature scientific Reports, July 19, 2017.
https://www.ncbi.nlm.nih.gov/pmc/articles/PMC5517600/
(48) Amazon Final Flip by 2035… “The carbon sink in live aboveground biomass in intact African tropical forests has been stable for the three decades to 2015, at 0.66 tonnes of carbon per hectare per year (95 per cent confidence interval 0.53–0.79), in contrast to the long-term decline in Amazonian forests. Therefore the carbon sink responses of Earth’s two largest expanses of tropical forest have diverged. The difference is largely driven by carbon losses from tree mortality, with no detectable multi-decadal trend in Africa and a long-term increase in Amazonia.” … ” In summary, our results indicate that although intact tropical forests remain major stores of carbon and are key centres of biodiversity, their ability to sequester additional carbon in trees is waning. In the 1990s intact forests removed 17% of anthropogenic CO2 emissions. This declined to an estimated 6% in the 2010s, because the pan-tropical weighted average per unit area sink strength declined by 33%, forest area decreased by 19% and anthropogenic CO2 emissions increased by 46%. Although tropical forests are more immediately threatened by deforestation46 and degradation, and the future carbon balance will also depend on secondary forest dynamics48 and forest restoration plans, our analyses show that they are also affected by atmospheric chemistry and climatic changes. Given that the intact tropical forest carbon sink is set to end sooner than even the most pessimistic climate-driven vegetation models predict, our analyses suggest that climate change impacts in the tropics may become more severe than predicted.”
FUTURE OF THE TROPICAL CARBON SINK “Our carbon gain and loss models (Table 2) can be used to make a tentative estimate of the future size of the per unit area intact forest carbon sink (Fig. 3). Extrapolations of the changes in the predictor variables from 1983–2015 forward to 31 December 2039 (Extended Data Fig. 5) show declines in the sink on both continents (Fig. 3). By 2030 the carbon sink in aboveground live biomass in intact African tropical forest is predicted to decline by 14% from the measured 2010–15 mean to 0.57 Mg C ha−1 yr−1 (2σ range, 0.16–0.96; Fig. 3). The Amazon sink continues to rapidly decline, reaching zero in 2035.” Interpretation – Hubau et al modelled past carbon sink decline into the future. This means that if current temperature and climatic trends continue, the Amazon sink will flip to emissions in 2035.
Hubau, Lewis et al., Asynchronous carbon sink saturation in African and Amazonian tropical forests, Nature, March 4, 2020.
(Researchgate free subscription) https://www.researchgate.net/publication/339927383_Asynchronous_Carbon_Sink_Saturation_in_African_and_Amazonian_Tropical_Forests
(49) The mayhem today is likely common, because not enough time has elapsed since our climate has changed for rare and overly extreme events to occur… The weather extremes today are likely common, because not enough time has elapsed since our climate has changed for rare and overly extreme events to occur. About the year 2000 or shortly thereafter, Earth’s temperature warmed above 0.5 C, known as the time of Antropogenic emergence (see reference 19), or the time that humankind began to change our climate beyond its evolutionary boundary conditions. Because warming is accelerating, most of the time since 2000 our temperature has not been much warmer than our old climate. In the first 14 years of the 21st century, warming was about 0.74 C, or about 0.24 C above the upper range of our old climate. In the last 6 years however, we have warmed to 1.02 C , or 0.27 C additional warming, more than doubling the first 14 years and now the climate change impacts are starting to become very meaningful.
(50) Complementary and Compulsory… Emissions reductions and simultaneously carbon dioxide removal (CDR) are compulsory – we cannot even meet 1.5 degrees C warming with emissions reductions alone unless we remove 1,000 Gt CO2 from our atmosphere. See “Up to 1,000 Gt” below. They are both complimentary because reducing emissions lowers the amount of CDR needed, and lowering Earth’s temperature with CDR reduces the amount of emissions we must create for cooling requirements.
Up to 1,000 gigatons (Gt) CO2 removal as per IPCC, Summary for Policymakers (SPM)… IPCC, 1.5 C Report Up to 1,000 Gt Negative Emissions… “All pathways that limit global warming to 1.5°C with limited or no overshoot project the use of carbon dioxide removal (CDR) on the order of 100–1000 GtCO2 over the 21st century. CDR would be used to compensate for residual emissions and, in most cases, achieve net negative emissions to return global warming to 1.5°C following a peak (high confidence).”
IPCC 1.5 C Report, Summary for Policymakers, Page 17, C.3, 2018.https://www.ipcc.ch/site/assets/uploads/sites/2/2019/05/SR15_SPM_version_report_LR.pdf
Realistically, the SPM understates as can be seen by findings presented in the rest of the report and as evaluated by Carbon Brief in the link below…. The realistic CDR quantity as presented by IPCC is 1,000 gt by 2100…Deeper analysis of the 1.5 C report shows that the 100 Gt range is not generally a part of the detailed presentation in the remainder of the report. Figure 2.13.c, Chapter 2, Mitigation Pathways, shows the cumulative amount of CDR needed to achieve 1.5 C by 2100 that includes a range of 100 to 1,250 Gt, not 100 to 1,000 Gt as stated in the Summary for Policymakers. Graph c in Figure 2.13 depicts this range with the blue dashed lines, with the green dashed line the most likely outcome (outlined in bright green by the author).
IPCC 1.5 C, Chapter 2, Figure 2.13, page 128:
https://www.ipcc.ch/site/assets/uploads/sites/2/2019/05/SR15_Chapter2_Low_Res.pdf
Chapter 2, IPCC SR15, Figure 2.13, page 128 Cumulative CDR by 2100, 1,000 Gt.jpg
Carbon Brief – IPCC Summary for Policy Makers Underestimates the details in the report… Carbon Brief interview with Oliver Greden, head of the research at the German Institute for International and Security Affairs say, “Compared to the full report, the SPM paints too rosy a picture on this. The SPM talks about 100-1,000Gt CO2 removal by 2100. But the report itself shows a mean CDR value much closer to the upper end of the 100-1,000GtCO2 range.”
In-depth Q&A, Carbon Brief, The IPCC’s special report on climate change at 1.5C, Carbon Brief, August 10, 2018.
Quote from Section: What role will ‘negative emissions’ play in limiting warming to 1.5C? Seventh paragraph.
https://www.carbonbrief.org/in-depth-qa-ipccs-special-report-on-climate-change-at-one-point-five-c
(51) Nearly 2,500 net zero plans globally… 2,484 Net-zero Plans: One-hundred twenty countries, 823 cities, and over 1,541 companies have net-zero plans in 2020.
Accelerating Net Zero, Data-Driven EnviroLab and New Climate Institute, 2020.
https://theconversation.com/net-zero-emissions-targets-are-everywhere-we-need-to-sort-the-genuine-from-the-greenwash-150127
(52) Warming in the pipeline, baked in warming or committed warming… Range of additional warming with zero further emissions of greenhouse gases is 0.5 C to 4.3 C, but 4.3 C is equilibrium sometimes post 2300.
IPCC 1.5 C Report committed warming of 0.5 C average, up to 1.2 C above 2020… Beginning in 2020, zero CO2 and aerosol emissions, and constant non-CO2 GHG forcing equals 0.5 C average additional warming by 2100, up to 1.2 C above 2020 max.
Worst-case IPCC, Zero CO2 and aerosol emissions, constant non-CO2 GHG forcing (green line) = 2.2 C above preindustrial at 2100.
IPCC 1.5 C, Chapter 1, Figure 1.5, page 65.
https://www.ipcc.ch/site/assets/uploads/sites/2/2019/05/SR15_Chapter1_Low_Res.pdf
Committed warming of up to 7.5 degrees F in the pipeline … (no cooling from aerosols) “The observed increase in the concentration of greenhouse gases (GHGs) since the preindustrial era has most likely committed the world to a warming of 2.4°C (1.4°C to 4.3°C) above the preindustrial surface temperature. The estimated warming of 2.4°C is the equilibrium warming above preindustrial temperatures that the world will observe even if GHG concentrations are held fixed at their 2005 concentration levels but without any other anthropogenic forcing such as the cooling effect of aerosols.”
Ramanthan and Feng, On avoiding dangerous anthropogenic interference with the climate system-Formidable challenges ahead, PNAS, September 2008, abstract.
http://www.pnas.org/content/early/2008/09/16/0803838105.full.pdf
Hansen 1.4 C committed warming at 385 ppm CO2… The remaining gap between equilibrium temperature for current atmospheric composition and actual global temperature is ~1.4°C. This further 1.4°C warming still to come is due to the slow surface albedo feedback, specifically ice sheet disintegration and vegetation change.
Hansen et al Target Atmospheric CO2 Where Should Humanity Aim Open Atmospheric Science Journal, November 2008 Highlights.
http://pubs.giss.nasa.gov/docs/2008/2008_Hansen_etal_1.pdf
Committed Warming with Net Zero… With zero emissions beginning immediately, global temperature will only fall back to 2000 levels in the next 200 years.
Mathews and Weaver, Committed Climate Warming, Nature, March 2010.
http://tinyurl.com/zyrq5m8
(53) National Academy of Sciences says the sustainable and equitable global nature-based CDR is 2.75 Gt CO2 per year… Many studies suggest much greater nature-based CDR is possible. There is a big difference however, between theoretical nature-based CDR capacity and plausible capacity, and an even further difference between plausible and sustainable and equitable capacity. Our Earth systems have an enormous amount of theoretical capacity to absorb extra CO2 through the enhancement of Earth systems: Forests, soils (agriculture), and oceans. Evaluation of the societal, economic and environmental consequences of “enhancing” these Earth systems yields a much smaller amount of “plausible” CDR because of the very large land use footprint of removing agricultural lands for the sole purpose of CDR, of the environmental consequences of changing global-scale earth systems to uses that are foreign and novel to those earth systems functions, and considering societal equity implications of challenging traditional low wealth cultures create CDR when their responsibility for the creation of climate pollution is almost zero. This is why the National Academy of Sciences quantity of nature-based CDR is so important, as it addresses the sustainable and equitable quantity, where other studies only address feasible or plausible nature-based CDR, or are consensus reports on nature-based CDR that do not differentiate the sustainable and equitable findings.
Quick Summary:
• The National Academy of Sciences Negative Emissions Technologies report in 2018 says 2.75 Gt plausible CDR per year globally is the safe, equitable atmospheric carbon dioxide removal with afforestation, reforestation, forest management, agriculture and soils.|
Negative Emissions Technologies and Reliable Sequestration, A Research Agenda, Consensus Study Report, Highlights, National Academy of Sciences, October 2018, Summary, page 2, paragraph 2 and 3, and Table. https://www.nap.edu/resource/25259/Negative%20Emissions%20Technologies.pdf
• IPCC says 4.4 Gt from AFOLU (agriculture, forestry and other land uses)
Chapter 2, IPCC SR15, Mitigation Pathways Compatible with 1.5 C in the Context of Sustainable Development, October 2018. Table 2.13c, page 128.
https://www.ipcc.ch/site/assets/uploads/sites/2/2019/05/SR15_Chapter2_Low_Res.pdf
• Hansen’s 2017 Young People’s Burden says 4.6 Gt plausible CDR annual from forests and soils across the globe.
Hansen et al., Young people’s burden-requirement of negative CO2 emissions, Earth Syst. Dynam., July 18, 2017, page 591, paragraph 1.
https://www.earth-syst-dynam.net/8/577/2017/esd-8-577-2017.pdf
• Paul Hawken’s 2017 Drawdown says 10 Gt plausible CDR annually from 23 forest, soils and agriculture strategies.
Hawken, Drawdown—The Most Comprehensive Plan Ever Proposed to Reverse Global Warming, Penguin Books, 2017.
https://www.drawdown.org/solutions
• Dicaprio’s One Earth Climate Model (Teske 2018) says 5.3 Gt plausible CDR per year, IMPORTANT – This work explicitly states that their 1.5 C scenario, “Refers to technically possible measures and options without taking into account societal barriers.”
Teske et al., Achieving the Paris Climate Agreement Goals, DiCaprio One Earth Climate Model, Springer Open, February 5, 2019.
https://link.springer.com/content/pdf/10.1007%2F978-3-030-05843-2.pdf
• Rocky Mountain Institute 2018 says 0.6 to 1.4 Gt CDR plausible per year from land-based negative emissions in the US.
Rocky Mountain Institute, Negative Emissions and Land Based Sequestration, November 2018, page 5.
https://www.rmi.org/wp-content/uploads/2018/11/RMI_Negative_Emissions_Scenarios_Report_2018.pdf
• Roe 2019, Contribution of the land sector to a 1.5C world… 6.5 Gt annual carbon dioxide equivalents (CO2eq) sequestration (CO2, CH4, N2O, etc.) feasible and sustainable nature-based strategies in the land sector.
Roe et al., 2019 Contribution of the land sector to a 1.5C world, Nature Climate Change, October 21, 2019.
(paywall) https://www.nature.com/articles/s41558-019-0591-9
Phys.org editorial – https://phys.org/news/2019-10-15c-experts.html
(54) Total Global Emissions… “From 1750 to 2011, CO2 emissions from fossil fuel combustion and cement production have released 375 [345 to 405] GtC to the atmosphere, while deforestation and other land use change are estimated to have released 180 [100 to 260] GtC. This results in cumulative anthropogenic emissions of 555 [470 to 640] GtC.”
555 GtC at 3.667 GtCO2 per GtC – 2035 Gt total global CO2 Emissions from 1750 to 2011.
IPCC 2013, Scientific Basis, Summary for Policymakers, page 12, second bullet.
http://www.climatechange2013.org/images/report/WG1AR5_SPM_FINAL.pdf
Emissions from 2011 to 2020: 9 years at an average of 39 Gt CO2 emission per year globally from fossil fuels, agriculture, forests, and land use changes is 351 Gt CO2.
http://cms2018a.globalcarbonatlas.org/en/content/global-carbon-budget
Total CO2 emissions from fossil fuels, cement, ag, forests, land use changes 1750 through 2020 is 2035 + 351 = 2386 Gt CO2.
(55) We made 24 billion pairs of shoes globally in 2019…
https://www.statista.com/statistics/1044823/global-footwear-production-quantity/
(56) We treat 116 gigatons of potable water and human sewage annually in the US… This giga scaling is something we know how to do well. We have done it with computer chips, solar cells and giga battery factories. We have giga scaled other things as simple as the 53 gigatons of aggregates that we mine every year to make concrete and roads. We treat about 52 gigatons of human sewage every year in the U.S. alone, and about 64 gigatons of potable water in the U.S. alone – 116 Gt total every year.
Human sewage treatment – https://www.epa.gov/nutrientpollution/sources-and-solutions-wastewater
Potable water treatment – https://www.infrastructurereportcard.org/cat-item/drinking_water/
(57) We use over 53 gigatons of aggregates across the planet every year… http://www.rockproducts.com/features/13045-world-aggregates-market.html#.XCl8OlVKi6J Mining Waste… The mining waste management market was valued at 165.22 billion tons in 2016 and is expected to reach 233.56 billion tons by 2022.
Mining Waste Management Market by Mining Method (Surface, and Underground), Metals/Minerals (Thermal Coal, Cooking Coal, Iron Ore, Gold, Copper, Nickel), Waste Type (Overburden/Waste Rock, Tailings, and Mine Water), and Region – Global Forecast to 2022.
https://www.marketsandmarkets.com/Market-Reports/mining-waste-management-market-104930371.html
(58) Direct Air Capture Cost Controversy…
August 2018, Bruce Melton
Climate Change Now Initiative, 501c3
(Revised January 2018, February 2017, September 2016, December 2015, December 2013)
Update August 2018: A paper in the journal Joule describes a carbon dioxide air capture industrial scale trial at the existing Carbon Engineering facility in Squamish, British Columbia that is removing 1,000 tons of CO2 per year, scaled using off the shelf processes and known scaling factors to the 1 million gigaton per year rate for $100 per ton. The process uses potassium hydroxide (potash) similar to that used in World War II in submarines to keep our sailors safe from carbon dioxide poisoning. This industrial trial uses $0.03 to $0.06 kWh natural gas energy with a 10 percent carbon penalty. With $0.01 kWh zero carbon energy (the cheapest wind and solar energy today is $0.02 to $0.03 kWh) costs will easily fall by half. Because large energy usage is required, it is very likely that site built utility scale generation will come with capture projects which eliminates transmission and energy company profits. Scaling from the megaton level today to the gigaton level required will easily drop prices by half again creating sub $12.50 per ton CO2 removal. This process also uses a 6 to 7 percent return on investment as profit which would not be included in costs for removal of already emitted climate pollution as a service to the commons. With disposal at 15 percent of removal costs, we are looking at total costs $15 per ton CO2 or less. To remove 1,000 gigatons then, would costs $15 trillion or $750 billion per year for 20 years. The U.S. military budget is $750 billion per year. We spend $500 billion a year on ensuring safe drinking water across the planet every year.
Keith et al., A Process for Capturing CO2 from the Atmosphere, Joule, August 15, 2018.
https://www.sciencedirect.com/science/article/pii/S2542435118302253
Keith 2018 costs of $94 to $232 per ton CO2 removal – Derivation of costs of $94 to $232 per ton CO2 and future projection for costs to the commons considering site-built utility scale alternative energy generation and no profit:
• The $94 to $232 per ton range reflects the low and high energy costs of the cheapest fracked gas at the time of $0.03 kWh to $0.06 kWh.
• Keith includes a 10% carbon penalty for the natural gas energy, in other words, his paper says it takes 10 percent more process to remove the carbon emitted from burning the natural gas to create the energy to run the process.
• In 2017 the best cost of new solar energy has fallen to $0.02 kWh – https://www.pv-magazine.com/2020/06/16/global-solar-capacity-may-reach-1448-gw-in-2024/
• Renewable 2021 – Morocco to England 10.5 Gw $0.013 kWh and $0.067 kWh wind
https://www.pv-magazine.com/2021/04/22/submarine-cable-to-connect-10-5-gw-wind-solar-complex-in-morocco-to-the-uk-grid/
• Offshore Wind $0.0075 kWh – https://www.pv-magazine.com/2017/09/11/uk-cfd-auction-sees-renewables-set-record-low-strike-price/
• Saudi Arabia 600 Mw Solar $0.0104 kWh
https://www.pv-magazine.com/2021/04/08/saudi-arabias-second-pv-tender-draws-world-record-low-bid-of-0104-kwh/
• Keith includes 8% profit which is irrelevant with DAC for the commons.
• Keith includes a 7.5 to 12.5 percent capitol recovery factor which is irrelevant with DAC for the commons.
• 87 percent of total costs are energy related.
Summary: Because DAC process use a significant amount of energy, any process scaled to a useful level with climate restoration will use the cheapest energy generation of on-site utility scale wind, solar and batteries, where batteries are at parity now in the most favorable locations and will be generally in a few years. On-site generation eliminates transmission costs and energy generator profit costs. With ENGIE forecasting $0.01 kWh wholesale, this means $0.075 kWh energy at the production facility.
Table 2 in Keith 2018, Summary Performance of Various Plant Configurations: Energy is about 80 percent of costs. Reducing energy costs from $0.03 kWh to $0.01 kWh is a two thirds reduction which puts the best-case cost of $94 per ton at $31 per ton.
For production to the commons, where no revenue generation/profit is required, backing out Keith’s 10 percent carbon penalty natural gas and his 8 percent assumed profit reduces the $31 per ton costs by 18 percent to $25 per ton. Process refinements and scaling to meaningful levels for climate restoration have the capacity to reduce costs by orders of magnitude as we see common in any gigascaling process. the closets example is solar PV that costs 35,000 percent more in 1976 than it does today.
Discussion… The economically infeasible theoretical evaluations of direct air capture (DAC) of carbon dioxide by the American Physical Society (APS) and Massachusetts Institute of Technology (MIT) from 2011 have now been disproven by industrial scale field processes installed and operational. MIT and APS hypothesized that direct air capture of carbon dioxide (DAC) would cost $600 to $1,000/ton. New, already completed and operational industrial scale DAC facilities are removing CO2 from the atmosphere today for $100/ton at Carbon Engineering in British Columbia, and $75 a ton at Global Thermostat in California with $25/ton using waste heat. These are both first run industrial designs with a likely 10x cost efficiency reduction possible with future generations of design. The processes also run on $0.07 to $0.10 kWh energy. New utility scale solar energy will be $0.01 in 2025 (ENGIE France), at about the time we can feasibly get large scale DAC into operation. This $0.01 kWh price is for all intents and purposes “waste heat,” because even waste heat has a price. The current reduction of solar to $0.01 kWh will approximately equal the cost of getting waste heat from where it is generated to where it is used.
The challenges with the theoretical MIT and APS works follow:
1) MIT and APS only discussed the basic physics of CO2 air capture of mature World War II era technology using sodium hydroxide.
2) Because of the outsized capacity for DAC to solve the climate pollution problem, the APS and MIT hypotheses garnered very significant press. Their costs were 10 times greater than the researchers studying the processes and their logic appeared sound: the basic physics of low concentration of CO2 in air is much harder to address than higher flue gas concentrations from power plant smokestacks.
3) Press coverage did not mention that new technologies were not evaluated, or that APS and MIT had made basic physics errors in enthalpy.
4) Several academic rebuttals did not make the news cycle and as a result, climate advocates, the public, and policy makers believe that the APS and MIT work is valid and DAC of carbon dioxide is cost prohibitive.
To their credit, and to the media’s discredit, APS and MIT works caveated appropriately saying they only evaluated mature processes and “new technologies could be game changers.” But more important, their basic physics was flawed as was pointed out by Realff and Eisenberger 2012. When valid physics is evaluated, the costs of new technology DAC is very similar to what the physics shows (see also Holmes and Kieth 2012) regardless of atmospheric concentration.
Because none of the rebuttal work was captured in the media cycle, the damage from incorrect media reporting was done and it persists in force today as even most climate scientists understand only what was captured in the media cycle and not the underlying science. The reason is because digging out the underlying science is simply not a priority for most climate scientists who must focus their energies on other disciplines. They trust the media to at least be fairly accurate. This trust allows invalid science to make its way into other academic work, repeated by other scientists who are not specialists in the DAC field, increasing the reach of the invalid science. As a consequence, public knowledge and most importantly–climate policy–are greatly hindered and our ability to move climate policy forward is badly diminished.
Hansen: How much does it cost to remove CO2 at $200 per ton?
50 ppm CO2 for $21 trillion using existing technologies … “Desire to reduce airborne CO2 raises the question of whether CO2 could be drawn from the air artificially. There are no large-scale technologies for CO2 air capture now, but with strong research and development support and industrial scale pilot projects sustained over decades it may be possible to achieve costs ~$200/tC or perhaps less. At $200/tC, ($55 per ton CO2) the cost of removing 50 ppm of CO2 is ~$20 trillion.”
Hansen et al., Target Atmospheric CO2 Where Should Humanity Aim? Open Atmospheric Science Journal, November 2008, page 226 and 227, Section 4.4 Policy Relevance, page 227, paragraph http://pubs.giss.nasa.gov/docs/2008/2008_Hansen_etal_1.pdf
DAC Basic Direct Air Capture Research (Literature Summary)
Direct air capture (DAC) costs… Goeppert et al., produced a literature summary of current DAC findings in 2012.
Goeppert et al., Air as the renewable carbon source of the future – CO2 Capture from the atmosphere, Energy and Environmental Science, May 1, 2012.Abstract only: http://pubs.rsc.org/en/Content/ArticleLanding/2012/EE/c2ee21586a#!divAbstract
$20 per ton (just over) capture and storage… Section 5.10 paragraph 2, “using the K2CO3/KHCO3 cycle is described as being able to capture CO2 from air for less than $20 per ton. The total cost including sub-surface injection was estimated to be slightly above $20 per ton.” COAway LLC
$49 to $80 per ton… Section 5.10 paragraph 3: “An air capture system designed by Keith et al. using a Na/Ca cycle was estimated to cost approximately $500 per ton C ($140 per ton CO2).81,98 The authors added that about a third of this cost was related to capital and maintenance cost. Further development and optimization of the system by Carbon Engineering Ltd.113 for the effective extraction of CO2 from air resulted in the decrease of the estimated cost to $49–80 per tonne CO2.” Keith, Ha-Duong and Stolaroff, Clim. Change, 2006, and Stolaroff, Capturing CO2 from ambient air: a feasibility assessment, PhD thesis, Carnegie Mellon University, Pittsburgh, PA, 2006. https://pdfs.semanticscholar.org/9914/742330cf30bff060bfece800de3d3445abe9.pdf
$53 to $127 per ton… Section 5.4.1, second paragraph: “The cost of CO2 capture in this case (excluding CO2 solution recovery and utilization or sequestration) was estimated to be between $53 and $127 per ton of CO2 depending on operating conditions, capital costs and mass transfer rate.” Stolaroff, Keith and Lowry, Environ. Sci. Technol., 2008. https://keith.seas.harvard.edu/files/tkg/files/97.stolaroff.aircapturecontactor.e.pdf
$30 per ton long term… Section 5.10, paragraph 5: “Lackner and co-workers developed an anionic exchange resin able to release CO2 in a moisture swing process. The cost of only the energy required per ton of CO2 collected was around $15. The initial cost of air capture including manufacturing and maintenance can be estimated at about $200 per ton of CO2. However, this cost is expected to drop considerably as more collectors are built, possibly putting CO2 capture in the $30 per ton range in the long term.” Lackner, Eur. Phys. J. Spec. Top., 2009, 176, 93–106. http://citeseerx.ist.psu.edu/viewdoc/download?doi=10.1.1.468.9580&rep=rep1&type=pdf Lackner, Sci. Am., 2010, 66–71 (paywall).
Conclusion, first paragraph (Goeppert)… “Despite its very low concentration of only 390 ppm, the capture of CO2 directly from the air is technically feasible. Theoretically, CO2 capture from the atmosphere would only require about 2 to 4 times as much energy as capture from flue gases, which is relatively modest considering that at the same time the CO2 concentration is decreased by roughly a factor of 250–300.”
American Physical Society (APS) and MIT say DAC is Cost Infeasible
American Physical Society Study… $80 per ton from Flue gas, $600 per ton for DAC using “mature technologies.”
Socolow et al., Direct Air Capture of CO2 with Chemicals, The American Physical Society, June 2011.
http://www.aps.org/policy/reports/assessments/upload/dac2011.pdf
MIT Study… $1,000 per ton
House et al., economic and energetic analysis of capturing CO2 from ambient air, PNAS, September 2011.
http://sequestration.mit.edu/pdf/1012253108full.pdf
Rebuttals: APS research revealed as significantly incomplete by Nature… Socolow 2011 [APS] evaluated existing WWII Era atmospheric removal technology and not surprisingly found them economically infeasible to address climate pollution.
Van Norden, Sucking carbon dioxide from air too costly, say physicists, Nature, May 11, 2011. http://blogs.nature.com/news/2011/05/sucking_carbon_dioxide_from_ai.html
Further rebuttal of APS and MIT (Holmes and Keith 2012)…Holmes and Keith identify short fallings of MIT and APS work calling out different design choices, insufficient optimization, and use of higher cost processes. When new DAC technologies are evaluated, costs are at or below those of mature DAC removal technology.
Holmes and Keith, An air-liquid contactor for large-scale capture of CO2 from air, Philosophical transactions of the Royal Society A, 370, 4380-4403, 2012.
http://rsta.royalsocietypublishing.org/content/370/1974/4380
Flawed analysis of the Basic physics of enthalpy (Realff and Eisenberger 2012)… These researchers point out a fundamental flaw in the work of APS and MIT showing direct air capture takes more energy than flue capture because of CO2 concentration: “The notion of minimum work does not apply to the capture of CO2, because the capture process is exothermic.” When CO2 is reacted with something to remove it from air or flue gas, the reaction creates heat, “is exothermic.” So instead of 400 kJ or work per mole CO2 energy required the actual energy required involves moving air over whatever process is used to remove the CO2 from the air. This is 6 kJ per mole CO2. This relationship of the actual costs of removal of CO2 from the atmosphere being 1.5 percent of the costs suggested by APS and MIT corresponds very well to the costs assumed by research evaluating new technologies of +/- $20 per ton. It is important to note that the cost of regenerating the chemicals used to capture the CO2, whether for flue gas or atmospheric capture, is identical.
Realff and Eisenberger, Flawed analysis of the possibility of air capture, June 19, 2012.
http://sequestration.mit.edu/pdf/2012_PNAS_StorageCapacity_LetterToEditor.pdf
Response to Realff and Eisenberg… Herzog et al. (House 2012) responded to Realff and Eisenberger’s circular argument by declaring that the excess energy from the exothermic reaction was not used as an input into the process because it was considered an inefficiency. This is not the point. The enthalpy was used backwards, and required heat be delivered to this portion of the process when none was required, significantly biasing the results. See the discussion in the link below—scroll down for the rebuttal rebuttal by Herzog et al.
http://sequestration.mit.edu/pdf/2012_PNAS_StorageCapacity_LetterToEditor.pdf
(58) Texas Drought kills 301 million trees… This was 6.2 percent of the trees in Texas. Normal mortality is less than 1 percent per year. Subsequent years also saw increased mortality though the numbers are not available. A big drought produces very long-live tree stress that can create mortality through other stressors like insects and disease. https://tfsweb.tamu.edu/TexasDrought-RuralAreas2011/
(Final) 301 million trees killed in Texas in the drought of 2011… Texas A&M Forest Service. https://tfsweb.tamu.edu/content/article.aspx?id=27436
See also, post oak decline (from climate change)…
Drought stress, then too much rain causes cascading impacts that can kill trees…
Texas A&M, Agrilife Extension Service, Rapid Decline of Post Oaks in Texas, October 2016
https://www.cityofbastrop.org/upload/page/0205/2016%20Post%20Oak%20Decline%20EPLP-033.pdf
(59) Keith’s $100 per ton…
Keith et al., A Process for Capturing CO2 from the Atmosphere, Joule, August 15, 2018.
https://www.sciencedirect.com/science/article/pii/S2542435118302253
(60) Carbon Engineering and Occidental Chemicals in the Permian Basin…
Occidental Chemicals and Carbon Engineering – https://www.technologyreview.com/s/613579/why-the-worlds-biggest-cosub2-sub-sucking-plant-would-be-used-to-err-dig-up-more-oil/
HOUSTON, Feb. 22, 2021 /PRNewswire/ — 1PointFive announced today its selection of Worley for the Front End Engineering and Design (FEED) phase of its first direct air capture (DAC) facility in the U.S. Permian Basin—DAC 1.
https://www.prnewswire.com/in/news-releases/1pointfive-selects-worley-for-feed-on-milestone-direct-air-capture-facility-837514192.html
Carbon Engineering Funders – Occidental Chemicals, Bill Gates, Murray Edwards, BHP, Chevron Technology Ventures, Oxy Low Carbon Ventures, LLC, Bethel Lands Corporation Ltd, Carbon Order, First Round Capital, Lowercase Capital, Rusheen Capital Management, LLC, Starlight Ventures, Thomvest Asset Management and others.
https://www.globenewswire.com/en/news-release/2019/03/21/1758562/0/en/Carbon-Engineering-concludes-USD-68-million-private-investment-round-and-proceeds-with-commercialization-of-carbon-dioxide-removal-technology.html#:~:text=CE’s%20investors%20now%20include%3A%20Bill,an%20affiliate%20of%20Peter%20J.
(61) Keith Cost Analysis … Keith 2018 costs of $94 to $232 per ton CO2 removal – Derivation of costs of $94 to $232 per ton CO2 and future projection for costs to the commons considering site-built utility scale alternative energy generation and no profit:
• The $94 to $232 per ton range reflects the low and high energy costs of the cheapest fracked gas at the time of $0.03 kWh to $0.06 kWh.
Keith’s (Carbon Engineering) Personal Communication 120918 on the range of $94 to $232 per ton removal: The $94 “low end” is actually “realistic end,” so he says to me personally. The $232 number considers $0.06 kWh natural gas energy, $94 is 0.03 kWh energy.
• Keith includes a 10% carbon penalty for the natural gas energy, in other words, his paper says it takes 10 percent more process to remove the carbon emitted from burning the natural gas to create the energy to run the process.
• The best cost of new solar energy has fallen to $0.02 kWh – https://www.pv-magazine.com/2020/06/16/global-solar-capacity-may-reach-1448-gw-in-2024/
• Engie France $0.01 kWh Solar – https://cleantechnica.com/2017/01/03/engie-sees-free-energy-10-per-barrel-oil-prices-2025/
• Keith includes 8% profit which is irrelevant with DAC for the commons.
• Keith includes a 7.5 to 12.5 percent capitol recovery factor which is irrelevant with DAC for the commons.
• The process has a levelized efficiency of 90 percent considering upstream and fugitive emissions in the process and sequestration transportation and injection.
• 87 percent of total costs are energy related. With just the cost of energy reduction of 66%, this is a $54.50 savings per ton. Reducing the non-energy costs of $12.22 by 10% for the carbon penalty, 8% for the profit and 10% for capitol recovery is another $3.42 in savings for a total of $57.82 making the cost $36.17 per ton.
(62) Storage capacity, permanence and costs…
Sequestration, Saline Aquifer CO2 storage in the US continental shelf…
Over 2,500 gigatons storage capacity in the US at less than $5 per gigaton.
Over 5,000 gigatons storage capacity in the US at $10 gigaton.
Vidas, et al., Analysis of the Costs and Benefits of CO2 Sequestration on the U.S. Outer Continental Shelf, Deportment of the Interior, OEC BOEM 2012-100, September 2012.
https://www.boem.gov/sites/default/files/uploadedFiles/BOEM/Oil_and_Gas_Energy_Program/Energy_Economics/External_Studies/OCS%20Sequestration%20Report.pdf
CarbFix, Iceland… CO2 is totally safe in 2 years.
Snaebjornsdottir et al., Carbon dioxide storage through mineral carbonation, Nature Reviews, Earth and Environment, January 20, 2020.
https://www.nature.com/articles/s43017-019-0011-8
In depleted oil and gas fields… There is likely room for storage of 1,000 Gt CO2.
https://ieaghg.org/docs/General_Docs/Reports/2009-12.pdf
Plausible, theoretical storage capacity… Total plausible storage in geologic formations (hydrocarbon reservoirs, and sedimentary and basalt rocks on land) is 70,000 to 985,000 Gigatons CO2, and an additional 6,000,000 Gigatons storage in seafloor periodites.
Kelemen et al., An Overview of the Status and Challenges of CO2 Storage in Minerals and Geological Formations Frontiers in Climate, November 15, 2019.
https://www.frontiersin.org/articles/10.3389/fclim.2019.00009/full
USGS CO2 Mineralization, Capacity, Costs and Location in the US… $0.50 to $200 per ton case studies of existing facilities, for in-situ and ex-situ saline aquifers, ultramafic and basalt rocks and industrial waste, with and without pressure management. Not gigascaled.
Blondes et al., Carbon Dioxide Mineralization Feasibility in the United States, USGS Report 2018-5079, 2019.
https://pubs.usgs.gov/sir/2018/5079/sir20185079.pdf
98 Percent Sequestration underground in 10,000 years… 2% leakage in 10,000 years with pressure management (2.000 tons per year for each 1 billion tons stored), 22% leakage with “unrealistic” poor pressure management, (22,000 tons per year per 1 billion tons stored). Alcade et al., Estimating geological CO2 storage security to deliver on climate mitigation, Nature Communications, June 12, 2018.
https://www.nature.com/articles/s41467-018-04423-1.pdf
(63) Enhanced oil recovery (EOR) to create carbon negative oil… about half of injected CO2 is returned to the surface with recovered oil. Making EOR carbon negative means simply closing the valve before this 50 percent of injected CO2 returns to the surface in the oil recovery process.
Guarina-Medimurec et al., Carbon Capture and Storage, CSS, Geologic Sequestration of CO2, Chapter, 2019.
(ResearchGate free account required) https://www.researchgate.net/publication/332176970_Carbon_Capture_and_Storage_CCS_Geological_Sequestration_of_CO_2
(64) 1,200 gigatons atmospheric CO2 removal required… Total emissions from 1750 to 2020 is about 2,400 Gt CO2 (see reference 54). Because half is absorbed by Earth systems, and because the total amount of annual emissions of CO2 is only about one percent of the total load of CO2 in the atmosphere (40 Gt annual emissions vs. 7.81 Tons of CO2 per ppm x 416 ppm CO2 average in 2020) half of emissions can be assumed to be instantaneously absorbed by earth systems. This leaves 1,300 gt Co2 to be removed to restore Earth’s atmosphere to conditions in 1750. To restore Earth’s CO2 cocnetration to within our climate’s natural variation, not all of the 1,200 Gt needs removed. But because the task is large and will take some time, there will be further emissions from humans and Earth systems feedbacks that all require removal. In addition, this concept does not include non-CO2 greenhouse gases which account for about a third of total warming we have experienced. The bottom line to restore our climate back to within our Earth systems evolutionary boundary conditions, we need to immediately remove all the CO2 we have emitted with mature CO2 removal processes and create net zero ASAP, and work on non-CO2 greenhouse gases.
(65) Costs of WWII Comparison to Climate Change Solutions… In WWII we spent $19 trillion dollars globally (2019 dollars) in 7 years, 1939 through 1945, on industrial expansion and mostly heavy manufacturing or $2.71 trillion 2019 US dollars per year. Total global GDP 1939 through 1945 in 2019 US Dollars was $44.6 trillion in 7 years or an average of $6.37 trillion 2019 US dollars per year. Average annual global WWII spending then, was 43 percent of global GDP. If we were to mimic WWII industrialization infrastructure spending today at 43 percent of global GDP of $87 trillion annually in 2019, this would be $37 trillion per year, or $261 trillion in seven years. It’s all about motivation and risk, not money.
(66) Clean Water Act… Clean Air and Clean Water Acts… “The Clean Water and Clean Air Acts each cost about one per cent of [U.S.] GDP”: Ken Caldeira quote. Caldiera is an atmospheric scientist that works at the Carnegie Institution for Science’s Department of Global Ecology. Although one percent of US GDP is $168 billion(2012), extended globally, we can legitimately compare one percent of efforts to control toilet pollution as being $500 billion annually across the world:
Specter, The Climate Fixers, The New Yorker, May 4, 2012, paragraph 38.
http://www.newyorker.com/reporting/2012/05/14/120514fa_fact_specter?currentPage=all
(67) Advertising, Ag damages, sick days, entertainment, US public energy costs, transportation, life insurance, US Health Care…
Health Care in the US 2019… $3.8 trillion
Keehan at al., National Health Expenditure Projections, 2019–28, Health Affairs April 2020.
https://www.healthaffairs.org/doi/pdf/10.1377/hlthaff.2020.00094
Advertising globally… We spend $500 billion every year on advertising across the globe: eMarketter, Asia-Pacific Poised to Dominate North America as World’s Top Ad Market, According to ‘Most Comprehensive’ Edition of the eMarketer Global Media Intelligence Report, October 10, 2012. $504 billion spent globally on total media ad spending. Forecast to $629 by 2015. Asia is expected to overtake North America as the worldwide leader in advertising dollars spent each year at some time in the next five years.
http://www.emarketer.com/newsroom/index.php/asiapacific-poised-dominate-north-america-worlds-top-ad-market-comprehensive-edition-emarketer-global-media-intelligence-report/
Agricultural Damages in the US… $500 billion in Agriculture Damages (not counting climate change) in the U.S. Every Year: Lazo et al., U.S. economic sensitivity to weather events, American Meteorological Society, June 2011.
http://journals.ametsoc.org/doi/pdf/10.1175/2011BAMS2928.1
Sick days in the US annually… We spend $576 billion every year in the U.S. on the costs of being sick at work: This includes incidental absence due to illness, workers comp, short-term disability, long term disability; Treatments at the doctor’s office and pharmacy, lost productivity and reduced performance. This is according to the Integrated Business Institute’s Full Cost Estimator.
Press Release: http://www.prnewswire.com/news-releases/poor-health-costs-us-economy-576-billion-according-to-the-integrated-benefits-institute-169460116.html
Life Insurance globally… $2.6 trillion in global life insurance premiums in 2012:
http://www.firstresearch.com/Industry-Research/Life-Insurance-Carriers.html
Entertainment in the US… $479 billion in entertainment in the U.S. in 2012:
The Price Warehouse Coopers Global Entertainment and Media Outlook: 2013-2017 tells us:
The U.S. entertainment and media market generated $479.23 billion in 2012, representing 29.2 percent of the worldwide revenue of nearly $1.639 trillion. In 2017, the U.S. is expected to account for $632.09 billion, or 29.4 percent of the worldwide total of more than $2.152 trillion
Paywall Report no data:
http://www.pwc.com/gx/en/global-entertainment-media-outlook/territory-segments-digital-forecast-overview.jhtml
Data:
http://www.hollywoodreporter.com/news/study-global-media-industry-poised-562694
Global Entertainment spending of U.S. $1.7 trillion…
https://www.pwc.com.tr/tr/industry/entertainment-media/outlook-global-entertainment-and-media-outlook-2016-2020.pdf
Fossil fuel subsidies globally… $1.9 trillion in fossil fuel subsidies globally says International Monetary Fund report in 2012:
http://www.imf.org/external/np/pp/eng/2013/012813.pdf
US energy costs 2010… $1.2 Trillion is what U.S. citizens spent on energy in 2010:
http://css.snre.umich.edu/css_doc/CSS03-11.pdf
US Energy Information Administration / Annual Energy Review 2011. Table 1.5 Energy Consumption, Expenditures, and Emissions Indicators Estimates, Selected Years, 1949-2011
http://www.eia.gov/totalenergy/data/annual/pdf/sec1_13.pdf
US Transportation costs in 2012… $1.1 Trillion is what U.S. citizens spent on transportation in 2012:
Bureau of Labor Statistics, Consumer Expenditures 2012, USDL-13-1833
http://www.bls.gov/news.release/pdf/cesan.pdf
<hr>
Bruce Melton, a longtime contributor to The Rag Blog and guest on Rag Radio, is a professional engineer, environmental researcher, filmmaker, climate science education specialist, author, and director of the Climate Change Now Initiative founded in 2005. He has written over 500 reviews of academic climate science, lectures regularly, and has recently been involved in ground breaking climate policy development where he was awarded a special achievement award by Sierra Club for helping in the establishment of new climate policy and a safer limit to warming that reverses already initiated ecological collapse and climate tipping. You can see his climate science reviews and films at ClimateDiscovery.org.
- Read more articles by Bruce Melton on The Rag Blog.
- Listen to Thorne Dreyer’s Rag Radio interviews with Bruce Melton.